


Archive of Returns Counter data as of Q1 2021
RECOMMENDED READING
The worlds of hedge funds and private equity are notoriously opaque. The Returns Counter aims to shed light on the overall performance in these industries as a starting point for understanding their claims of economic value. The Counter aggregates returns data from multiple sources to create a simple metric—a “Returns Counter Average” that can be directly compared against public market benchmarks.
The Returns Counter is part of American Compass’s Coin-Flip Capitalism project. For more, start with Coin-Flip Capitalism: A Primer.
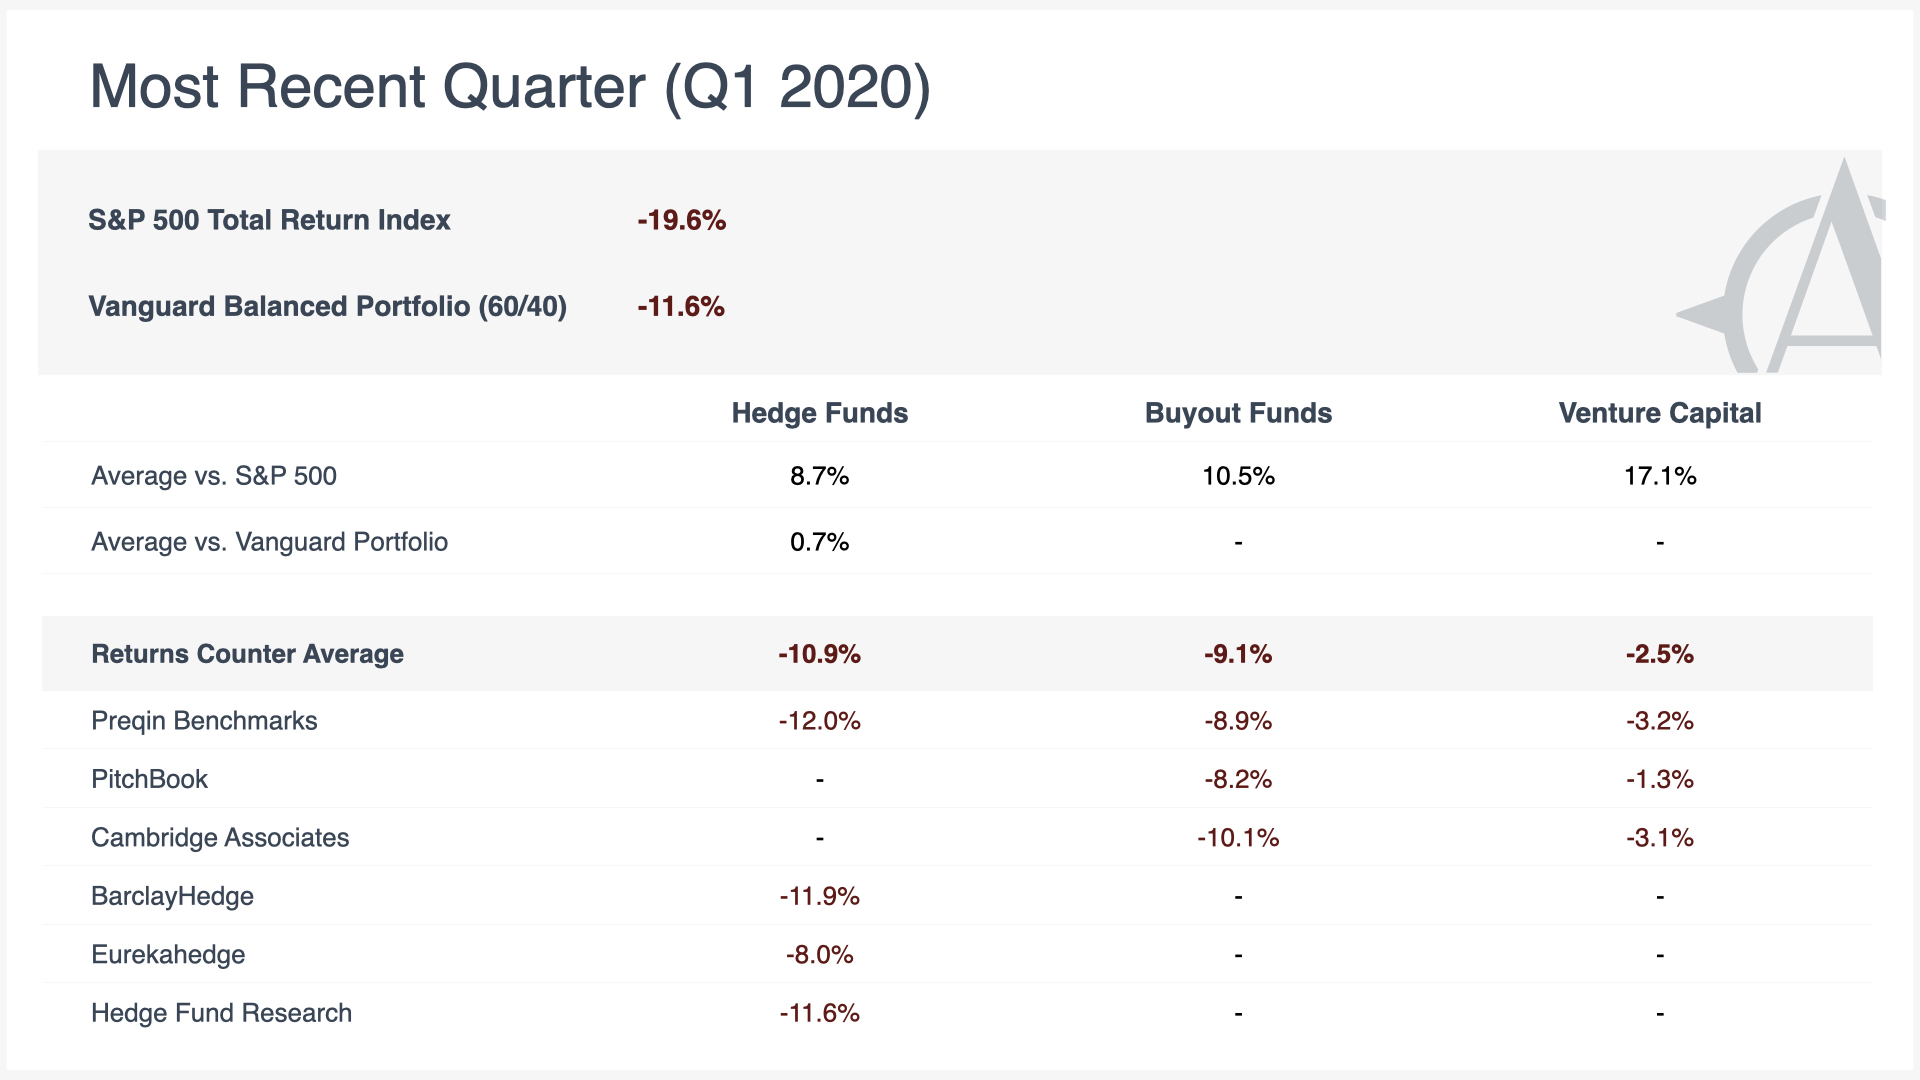
Note: Private equity data are published on a one-year delay. The figures below reflect the most recent available data for buyout and venture capital funds. For consistency, the Returns Counter uses the same time period for hedge fund performance.
Overview
Sources and Methodology1Preqin: Hedge Fund Benchmarks and PrEQIn Index; PitchBook: Private Markets Benchmarks; Cambridge Associates: U.S. Venture Capital and Private Equity Index and Selected Benchmark Statistics; BarclayHedge: Barclay Hedge Fund Index; Eurekahedge: Eurekahedge Equal Weighted Hedge Fund Index; Hedge Fund Research: HFRI Fund Weighted Composite Index.
Hedge Funds
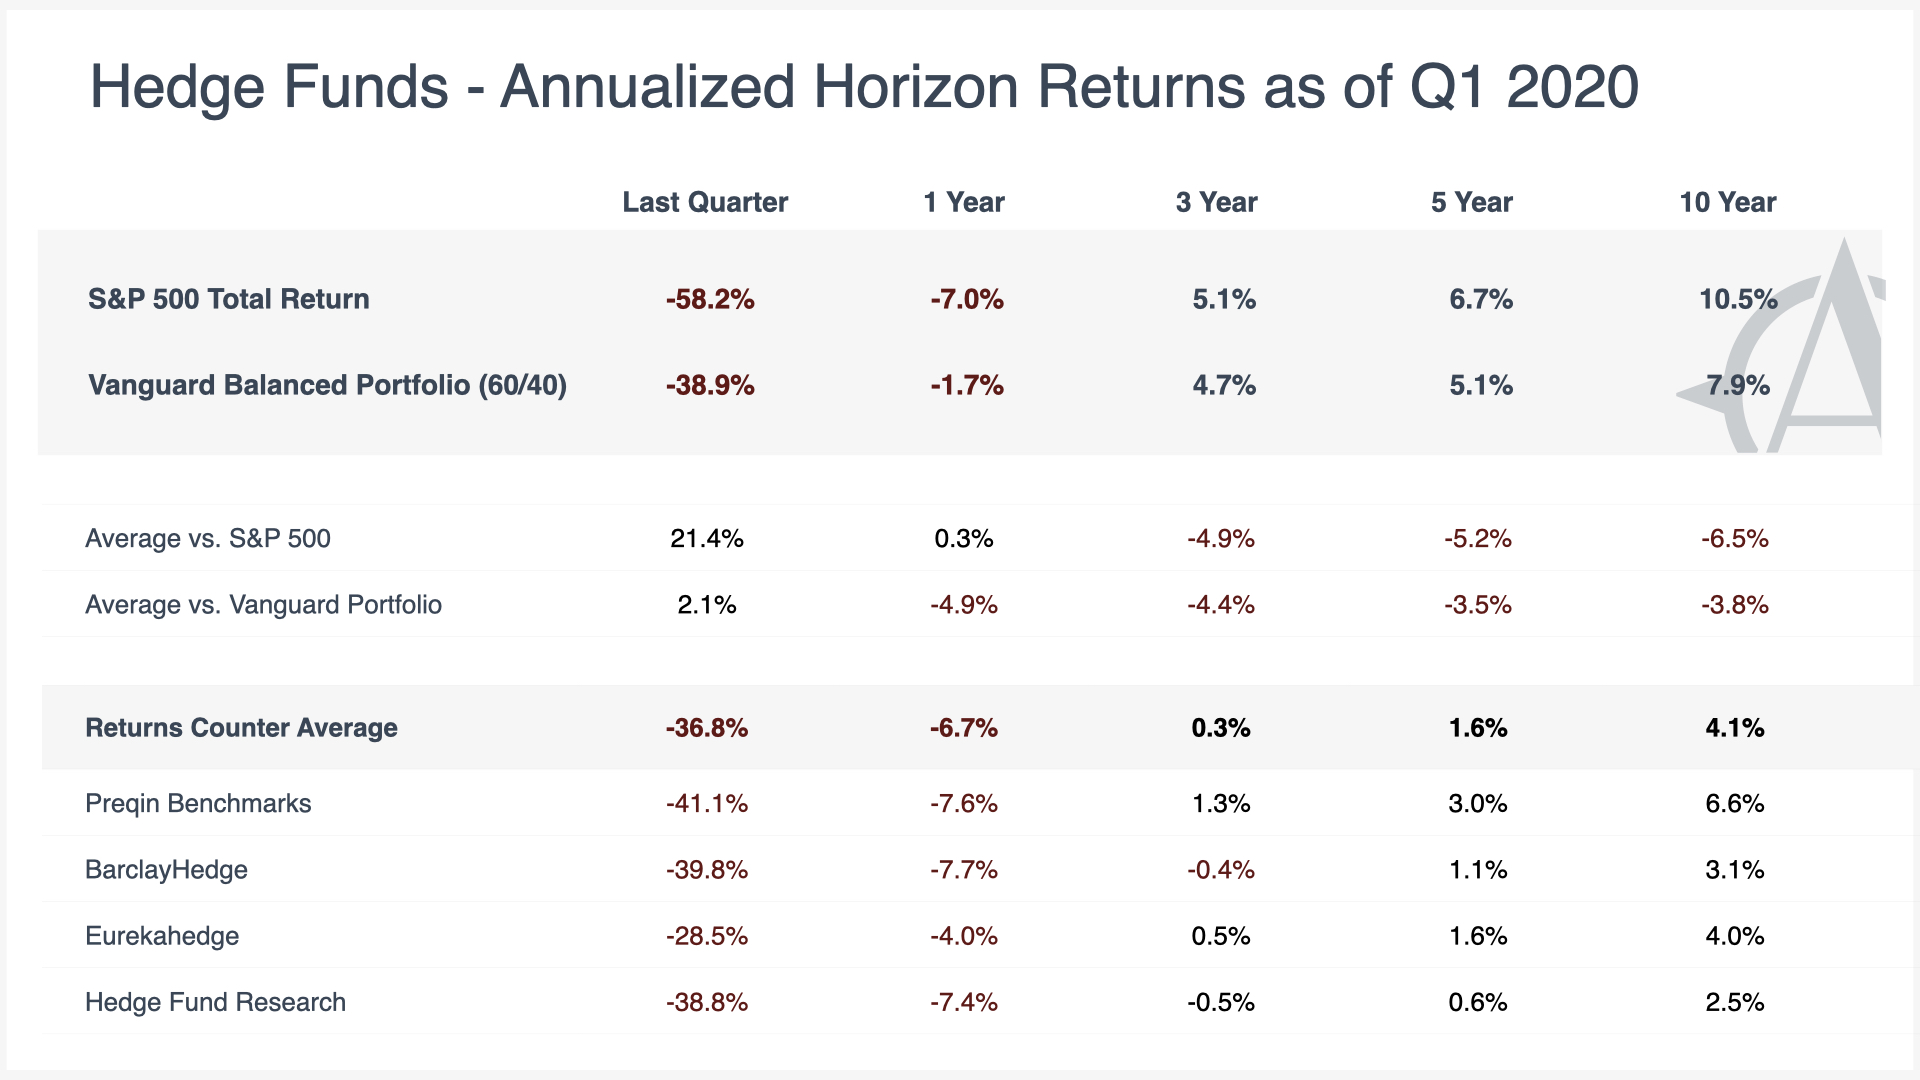
Sources and Methodology2Preqin: Hedge Fund Benchmarks (North American – All Strategies); BarclayHedge: Barclay Hedge Fund Index; Eurekahedge: Eurekahedge Equal Weighted Hedge Fund Index; Hedge Fund Research: HFRI Fund Weighted Composite Index.
Buyout Funds
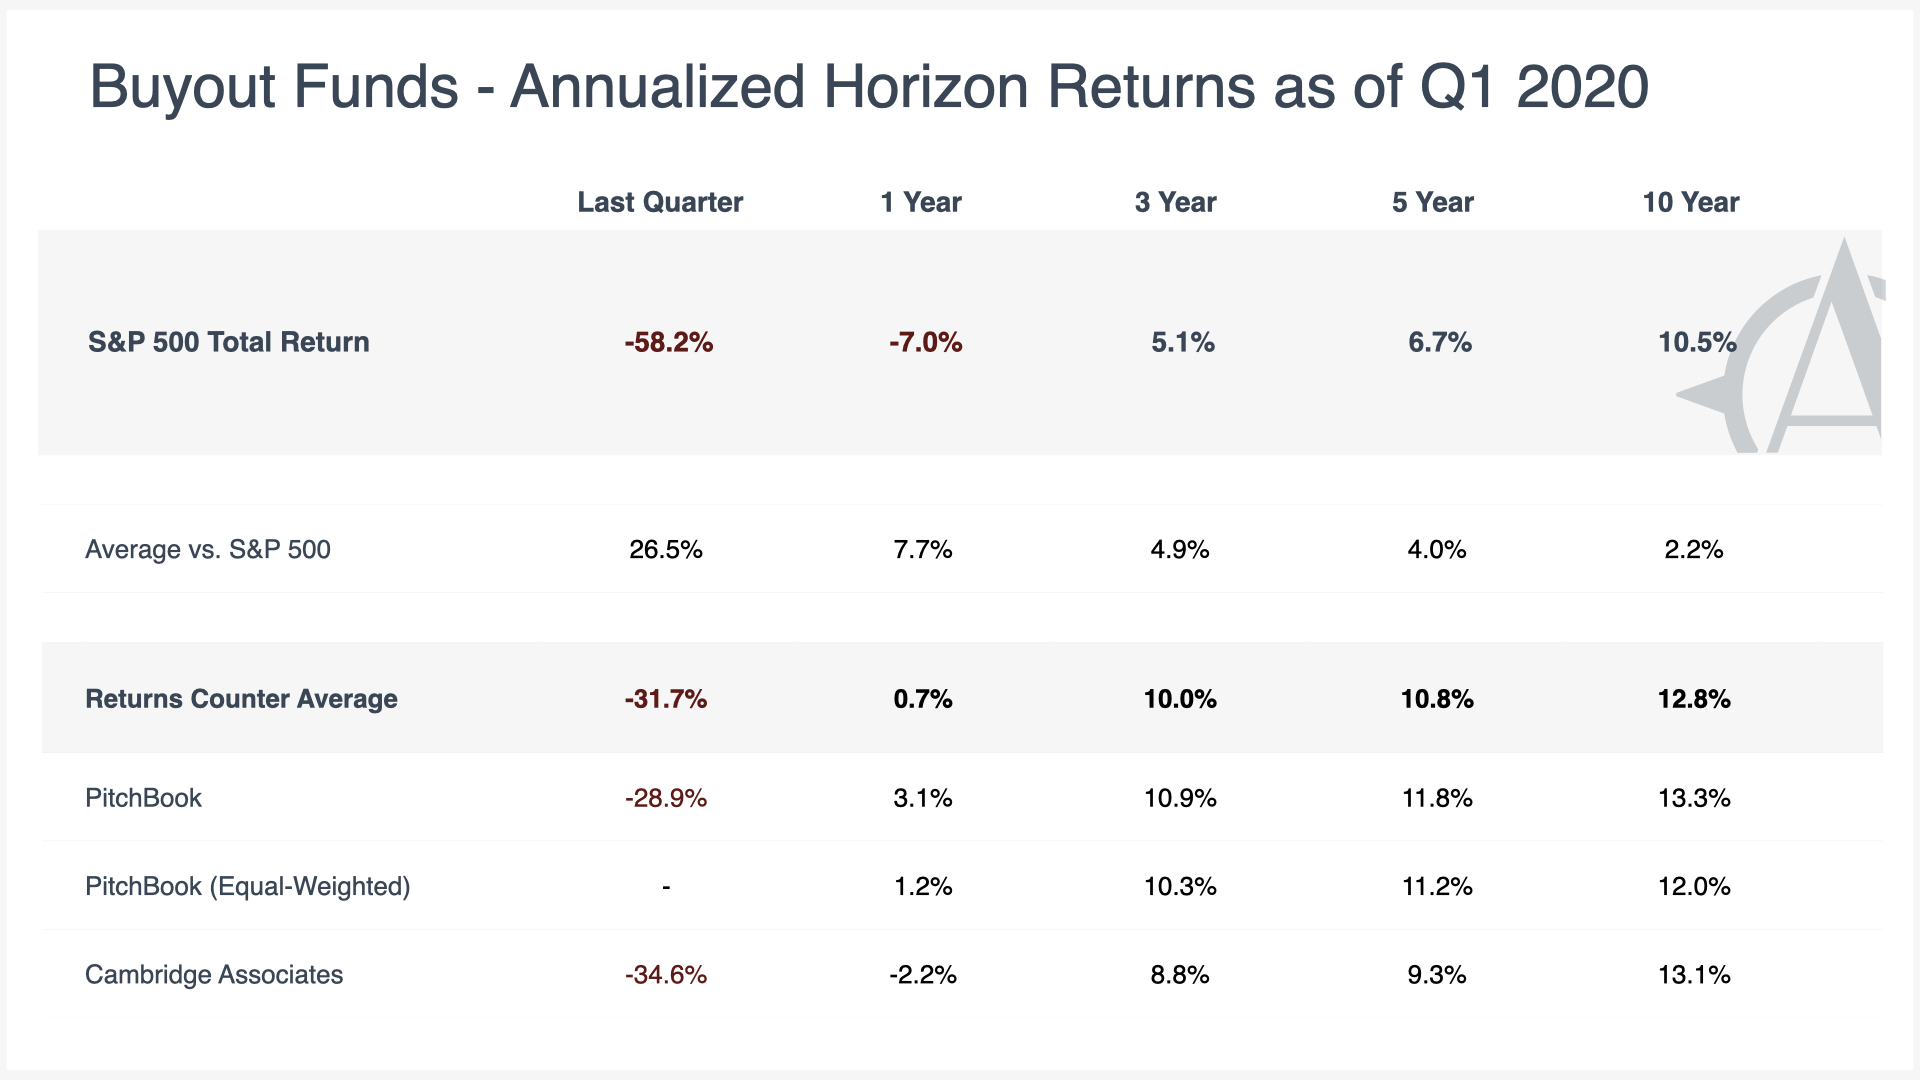
Sources and Methodology3PitchBook: Private Markets Benchmarks; Cambridge Associates: U.S. Venture Capital and Private Equity Index and Selected Benchmark Statistics.
Venture Capital
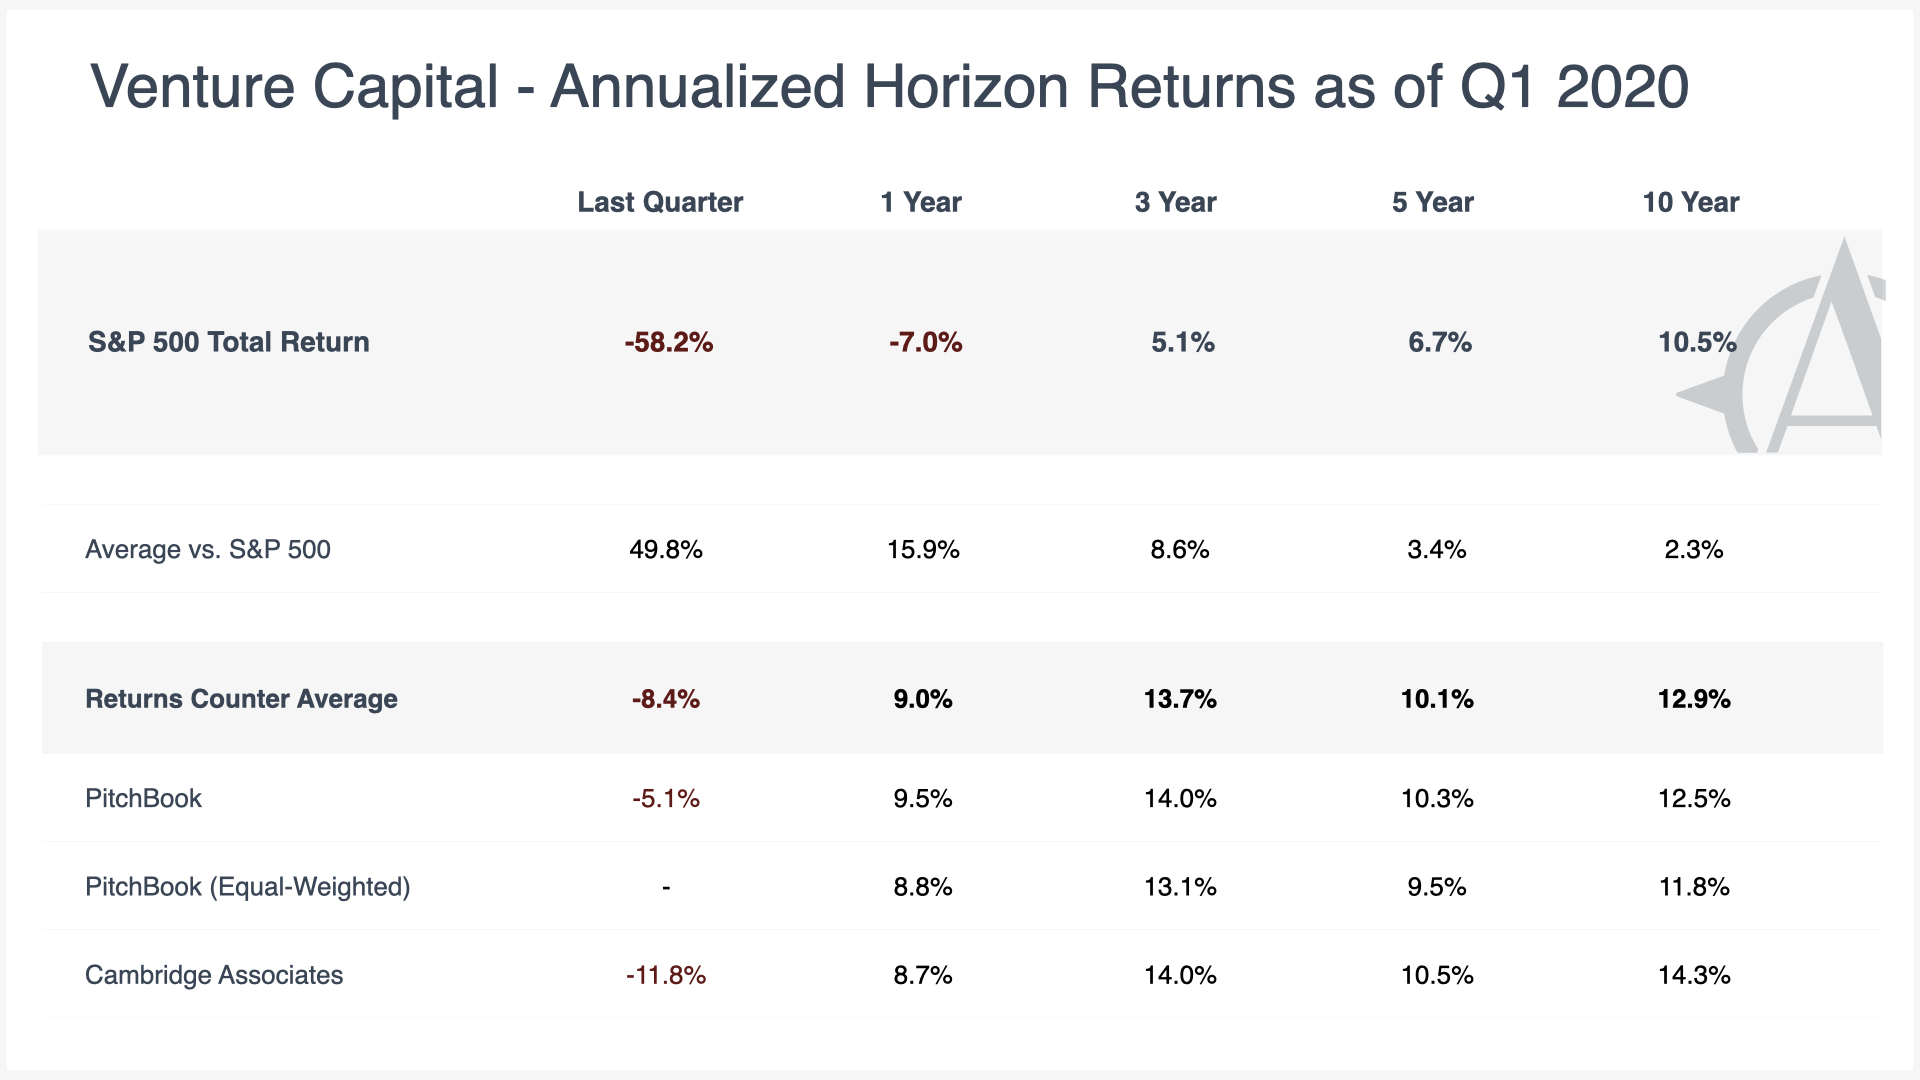
Sources and Methodology4PitchBook: Private Markets Benchmarks; Cambridge Associates: U.S. Venture Capital and Private Equity Index and Selected Benchmark Statistics.
Market Benchmarks serve as a proxy for performance in the stock and bond markets. The S&P 500 Index is a conventional benchmark for assessing the performance of the U.S. stock market. It includes the stock of 500 large companies traded at NASDAQ and the New York Stock Exchange and represents approximately 80% of available market capitalization. The Vanguard Balanced Index Fund (VBIAX), which offers a balanced portfolio allocated 60% to a broad U.S. stock market index and 40% to a broad U.S. bond market index, reflects performance of a balanced portfolio with broad exposure to the U.S. equity and bond markets.
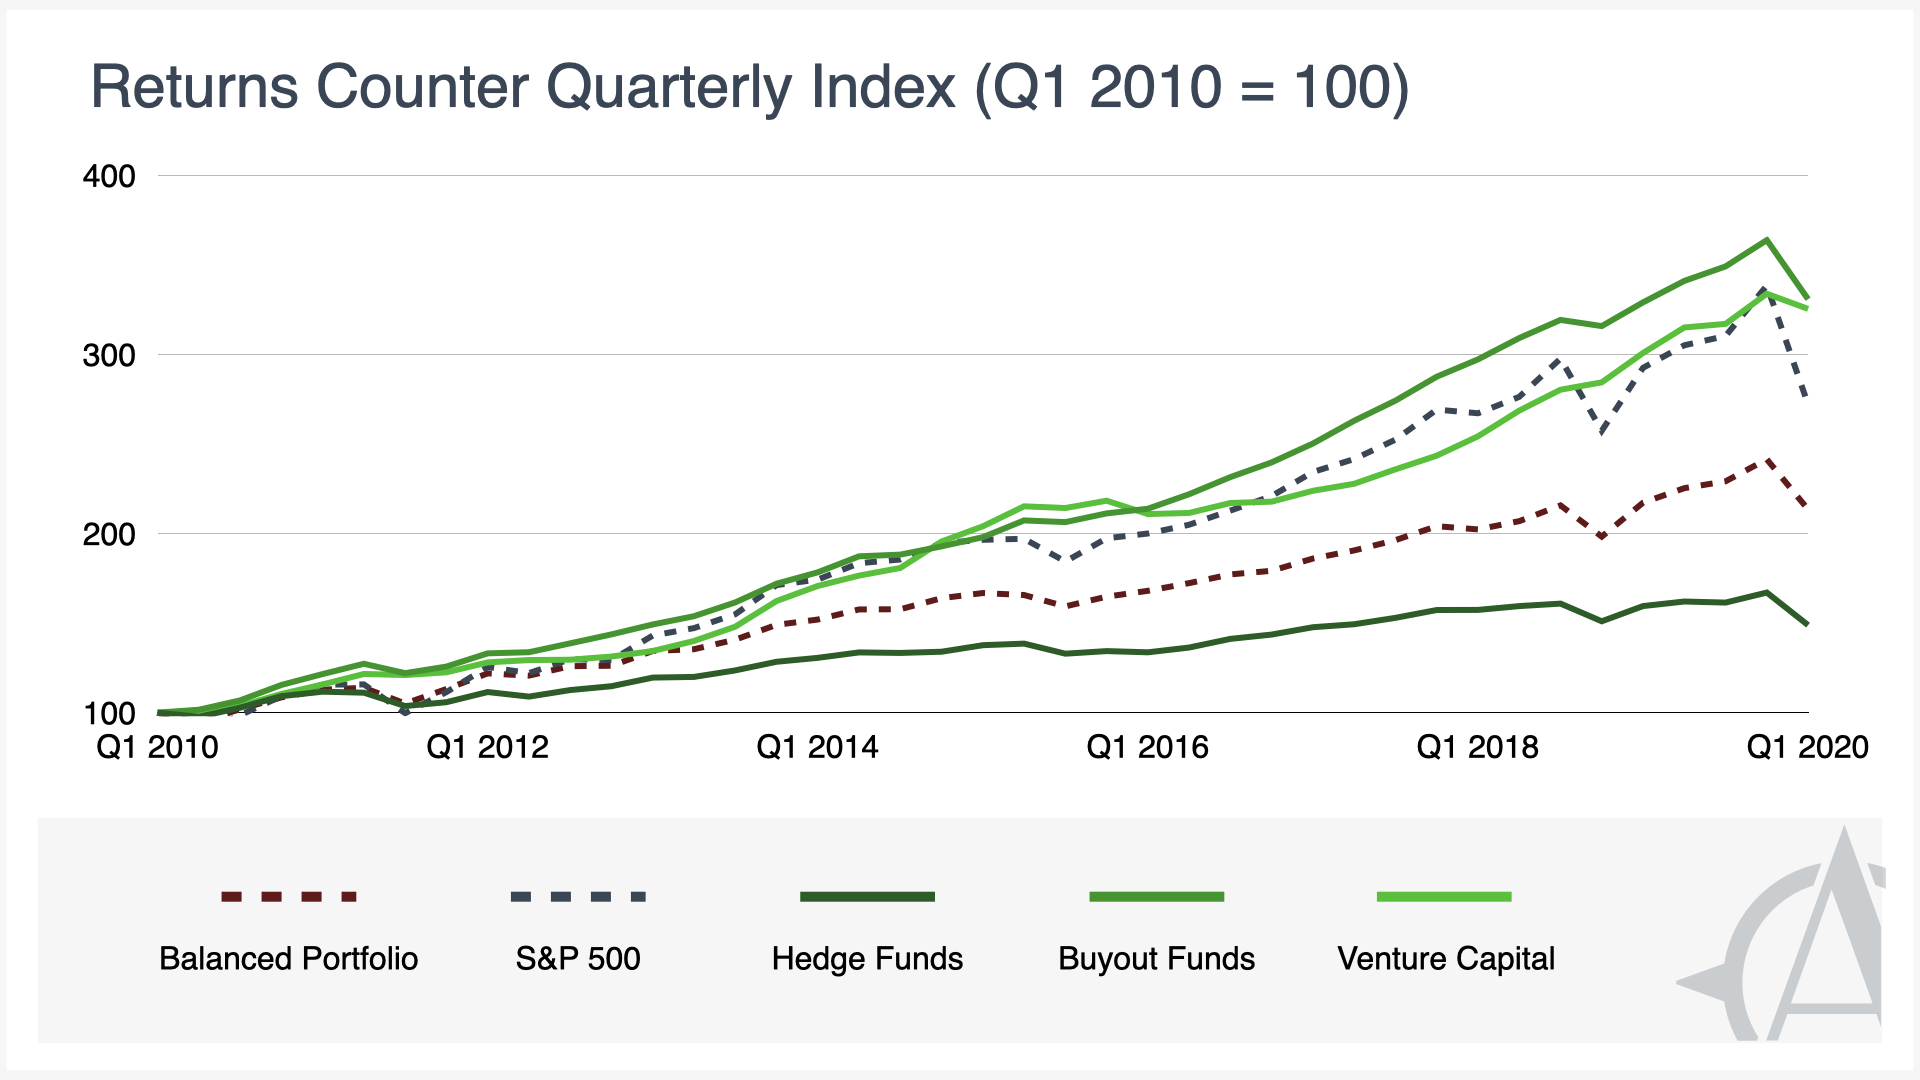
Quarterly Index provides a simple portrait of performance over the preceding decade. The figures represent what an investor could expect to earn from a $100 investment across any asset category, calculated by aggregating and compounding the returns reported each quarter over the ten-year period.
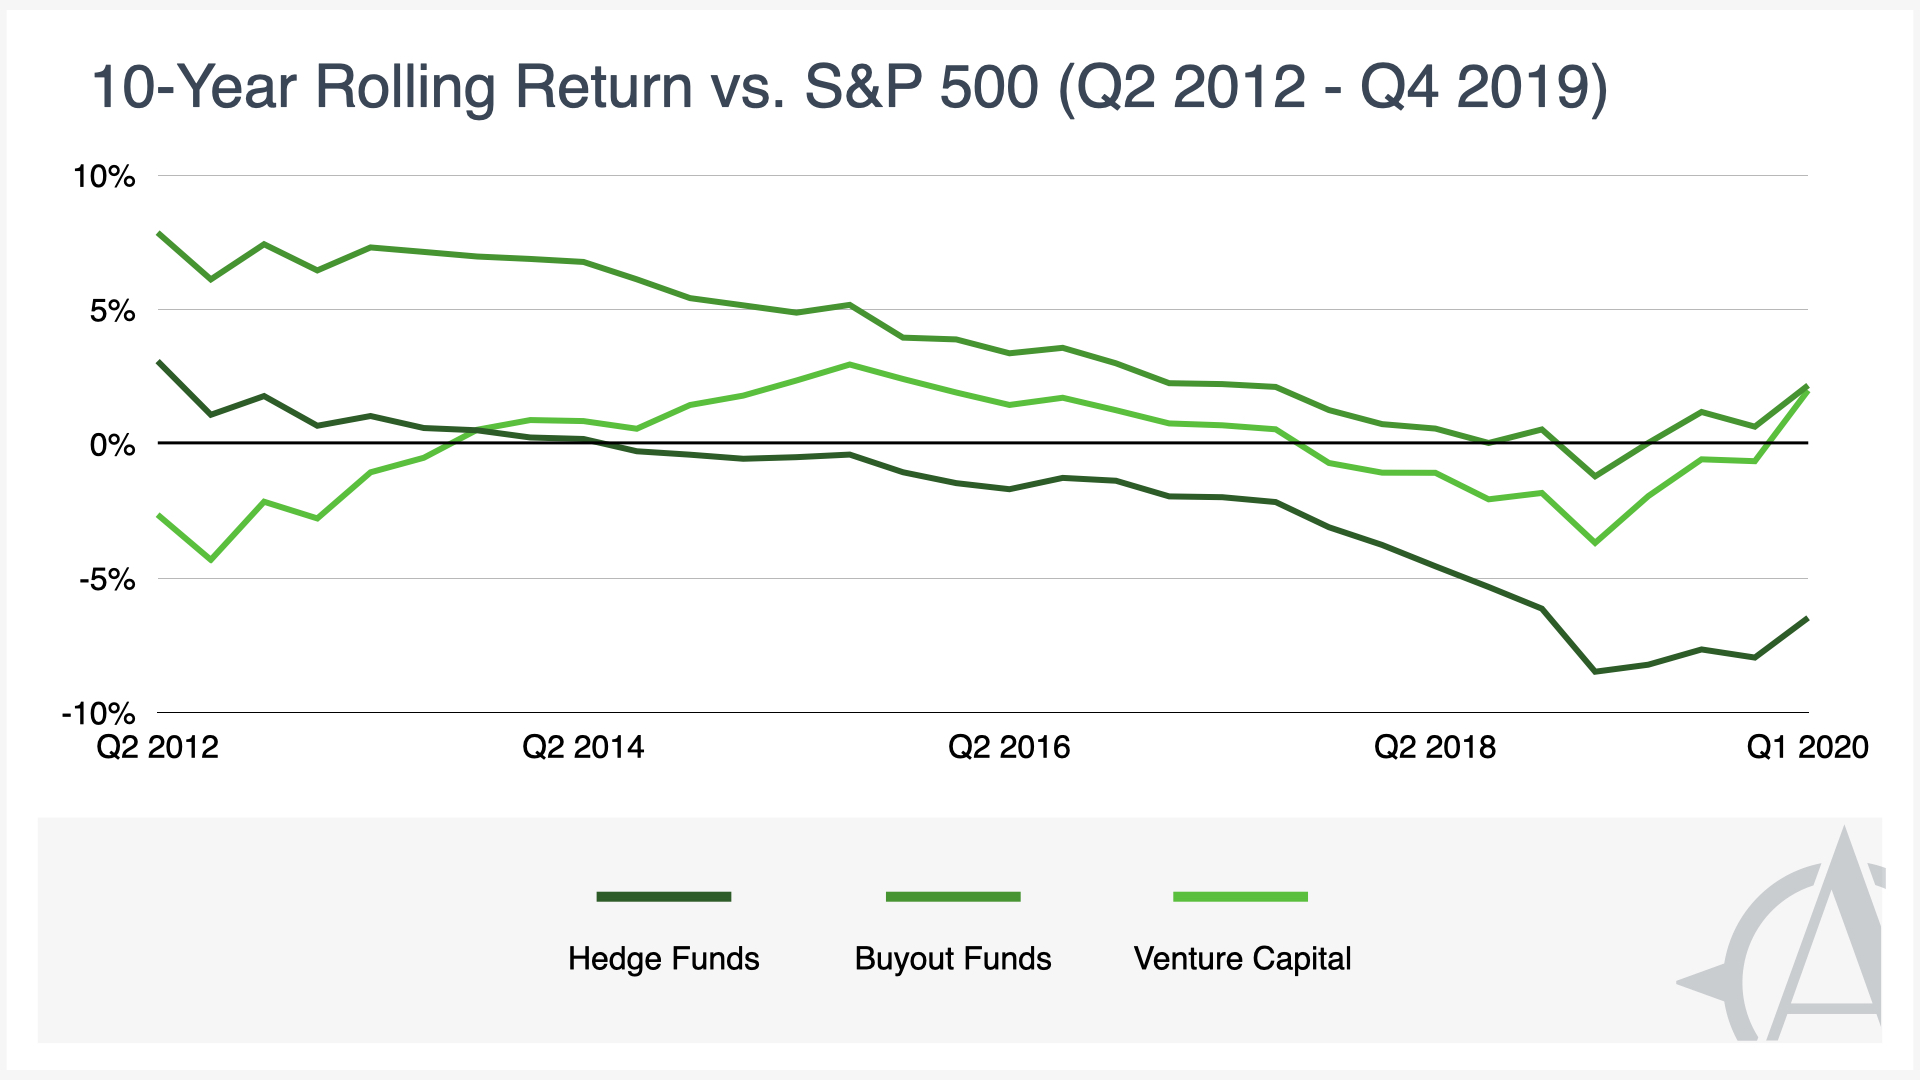
10-Year Rolling Returns track trends in long-term performance. It shows the percentage-point over- or under-performance of alternative asset classes versus the S&P 500, as measured by annualized returns over the previous 10 years.
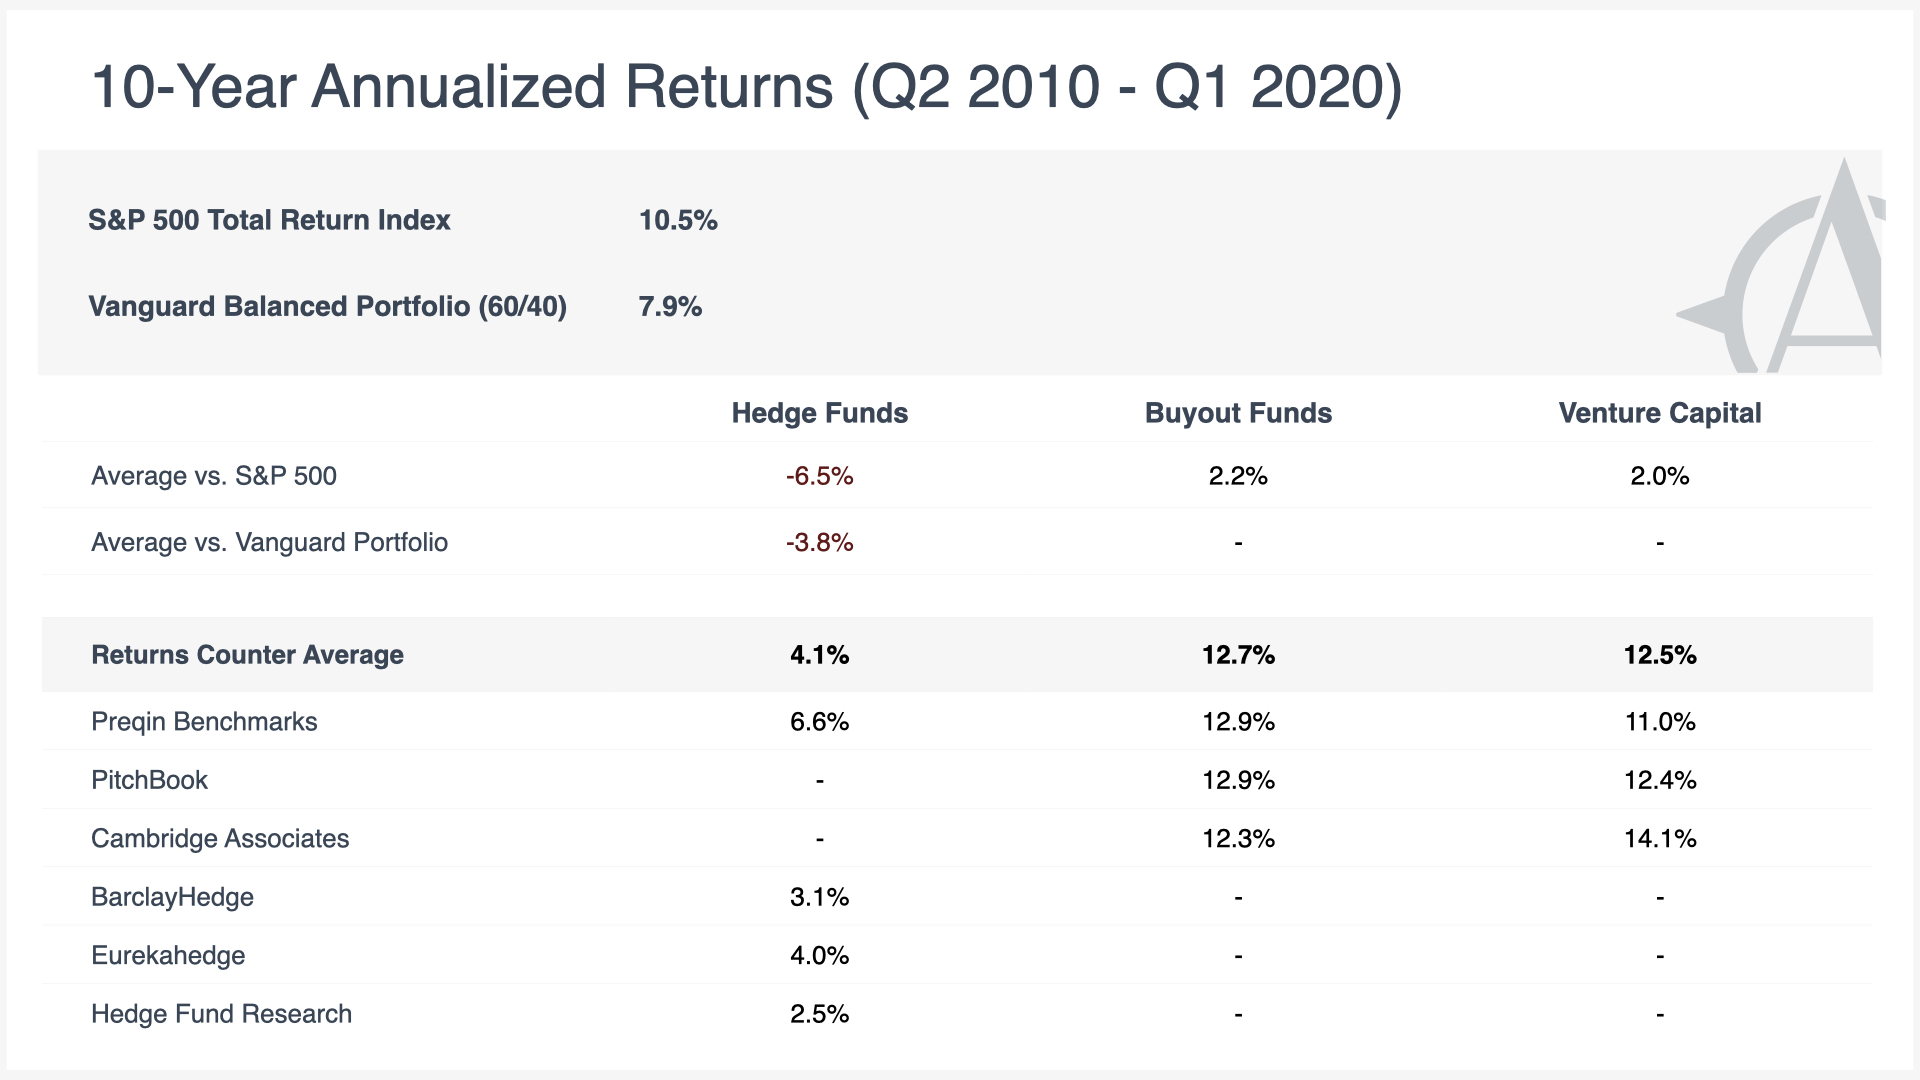
Horizon Returns measure performance over different time frames—including the preceding quarter and year. All figures are annualized. Hedge fund values are calculated as simple returns on investment. Buyout and venture capital figures reflect a different measure: internal rate of return (IRR), the conventional metric used by private equity firms to calculate the returns delivered to investors. Research firms calculate horizon returns independently from quarterly estimates, so ten-year horizon returns may differ slightly from the aggregated ten years of quarterly returns reported for the Quarterly Index.
Recommended Reading

The Returns Counter
Comprehensive benchmarking of the hedge fund, private equity, and venture capital industries against public-market indexes, updated quarterly.
The Returns Counter (Q3 2019)
Archive of Returns Counter data as of Q3 2020
The Returns Counter (Q2 2019)
Archive of Returns Counter data as of Q2 2020