


Well, good morning everyone. Thank you for being here. Thank you Scott and Angela for inviting me. This is one of my favorite places to be here in Washington. I think there are a tremendous amount of important debates going on within conservatism about how to understand what’s happening in America and, as Scott explained in the intro, based on how we understand that, what if anything we need to do about it.
As Scott alluded to a little bit, the paper that I published in 2020 called The Cost of Thriving Index, I think, was a somewhat disruptive entry into the debate over what has been going on with household finances because it sought quite explicitly to move beyond the traditional economic measures.
[Read more about the Cost-of-Thriving Index]
My motivation doing this actually started with my book in 2018, The Once and Future Worker, that focused very explicitly on this strange dichotomy. On the one hand, the economic data suggested that everyone in America should be very happy. Material living standards across all income strata were at all-time highs. GDP was at an all-time high. We all had iPhones in our pockets, and so forth. Yet there was clearly very widespread frustration with economic conditions. There was, as Angela was describing, this widespread perception that it has in fact become harder to raise a family, particularly on a single income. I was very curious about this and concerned that particularly on the right of center, we had fallen into a habit of saying to the world, “Who are you going to believe, me or your lying eyes?” If the statistics say you’re doing well and you say you have problems, well then you’re the problem. That strikes me as neither substantively nor politically wise as an approach to governing.
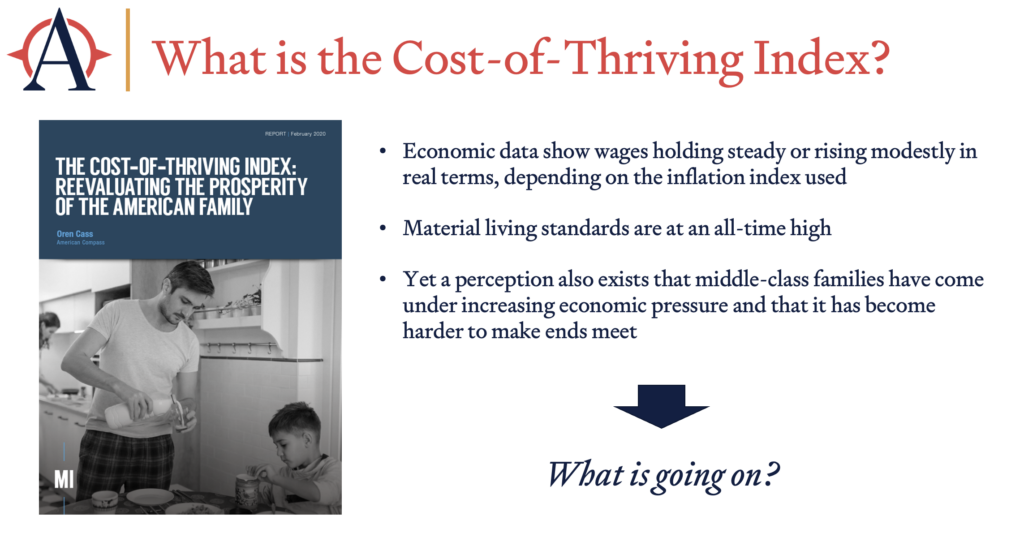
The paper that I published with the Manhattan Institute at the start of 2020 had this departure point. Economic data show wages holding steady or rising modestly, material living standards at all-time high. Yet perception exists that middle class families are under increasing pressure. So what’s going on?
It seemed to me there were three possible sources of disconnect. What could be going on that the traditional inflation measures weren’t capturing?
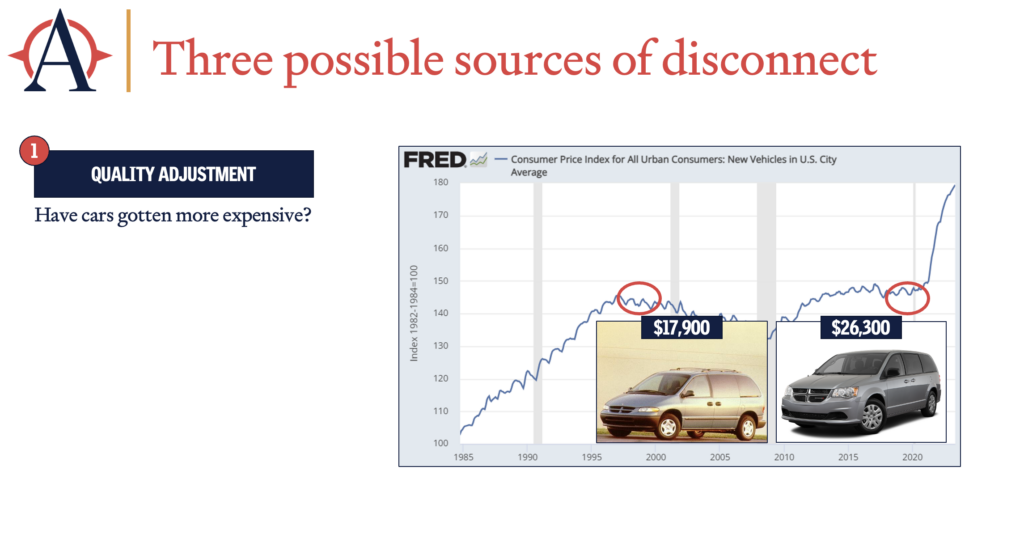
One of these is the question of quality adjustment. Do we think cars have become more expensive, as an example? Now for an official inflation measure, what you want to know is what you are paying for a car of comparable quality or utility. So if cars get nicer and have more widgets in them and heated seats, you should expect them to get more expensive. That’s not actually seen as a cost increase in terms of inflation. You see this in the data. This is the Consumer Price Index measure for new vehicles. What you’ll notice is, from roughly 1996 to 2018, there was, according to the Bureau of Labor Statistics, no increase in the price of a car. If you actually look at a Dodge Caravan entry-level minivan for your family, the sticker price had risen about $8,000.
Now, what the BLS economists are saying is, “But there’s $8,000 more content in the van, so there’s no inflation here.” That’s true. You do get a much better car in 2018 than you do in 1996. It can also be true that if you’re a family that would like to buy a minivan in 2018, it costs more than it did in 1996. These are two ideas that we have to be able to hold in our head at the same time.
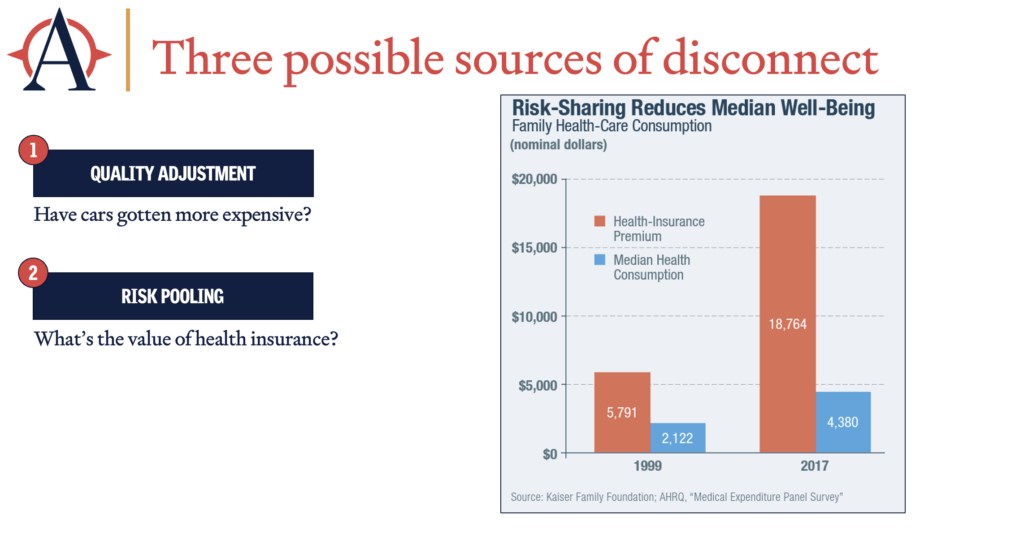
The second one, and this comes up particularly in the context of health insurance, is a problem of risk pooling. We have some important products, and health insurance is by far the largest, where the whole premise is we all pay in and only some people actually use it. With healthcare in particular, if you think about how healthcare has proceeded in recent decades, a lot of the gains are in very high-end, expensive care that only some people, typically very, very few people, need. So from one perspective, from the economist’s perspective, that’s an incredible gain. If your healthcare premium is three times as high as it used to be, but if you have that rare form of leukemia, they can treat it, that’s amazing. It’s also true that if you are the 99.9% of families who do not need the million dollar treatment, you also pay the same premium and don’t use any of those services.
So the two values I’m contrasting here are, on one hand in the orange, the health insurance premium, and then on the other hand in blue, the median health consumption, what your typical family actually uses in healthcare. Now, Scott and others have been correct in pointing out that this is slightly apples to oranges, in that the healthcare premium is a mean, it’s the overall average, whereas the blue bar is a median. Typically, comparing means and medians is a no-no. The reason I’m fairly comfortable doing it here is because the whole premise of health insurance is that we all pay roughly the same amount. I imagine if we had a good measure of median health insurance premium, it might look slightly lower, but it would not change the reality that a significant amount of the increased cost in health insurance, which economists would say is not a cost increase because the higher and more expensive and better quality healthcare is embedded within it, is still something that everybody is paying for and very few people ultimately use. We need to keep in our head both the idea that we are all better off because we have access to the leukemia treatment if we need it, and the typical middle class family may feel much greater cost pressure than they did in the past.
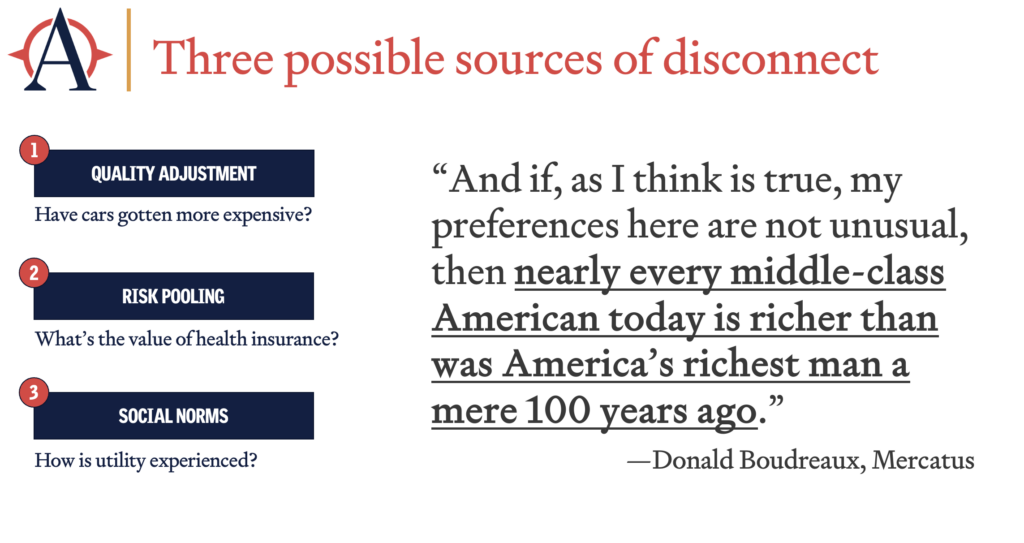
Third, social norms. How is utility experienced? One thing I really appreciate about Angela’s paper is that it addresses this directly, that economists quite explicitly do not consider the social lens through which we all consume and experience life. Giving your child a brand new 1977 bicycle for his birthday in 1977 is a different experience than giving your child a brand new 1977 bicycle for his birthday in 2022 … I believe. Economists would say that’s not what inflation measures. I would agree that’s not what inflation measures, and I would say we still need to care about it.
This is just my favorite example of this. There’s this great little category of writing on the libertarian right that argues things like, “Actually, Louis the XIV was worse off than someone earning $25,000 today.” It’s like, yes, I guess that’s true, and it can also be incredibly not true. This is my friend Donald Boudreaux from Mercatus looking at John Rockefeller and arguing that he would not for a billion dollars trade places with John Rockefeller a century ago. In fact, nearly every middle class American today is richer than was America’s richest man a mere 100 years ago. There is a perspective from which that is true. If that is the only perspective through which we try to understand what is happening to American families, I think we will end up very, very wrong.
What we did with the Cost-of-Thriving Index was to say, what could we develop that tries to get to this intuition that life feels more expensive, even though the inflation data says it’s not? This very explicitly does not try to be an inflation measure. It does not care about quality adjustment. It does not care about the things that economists very carefully measure to get the inflation numbers right, because we already have those inflation measures. The Cost-of-Thriving Index is very explicit, those measures are useful too. That is part of the conversation, but this can add something as well.
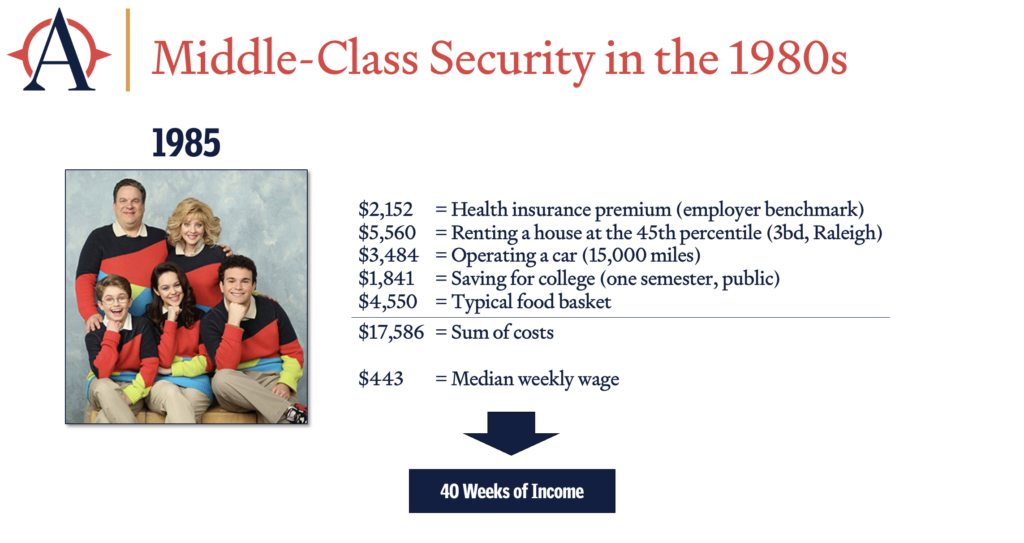
What we do is we take these five elements, and we can talk more about why we chose these five, but a health insurance premium, renting a house near the median, operating a car, saving for college, typical basket of food, look at what that costs and compare that to the median male wage. What you see is it took about 40 weeks of income to cover all of that in 1985.
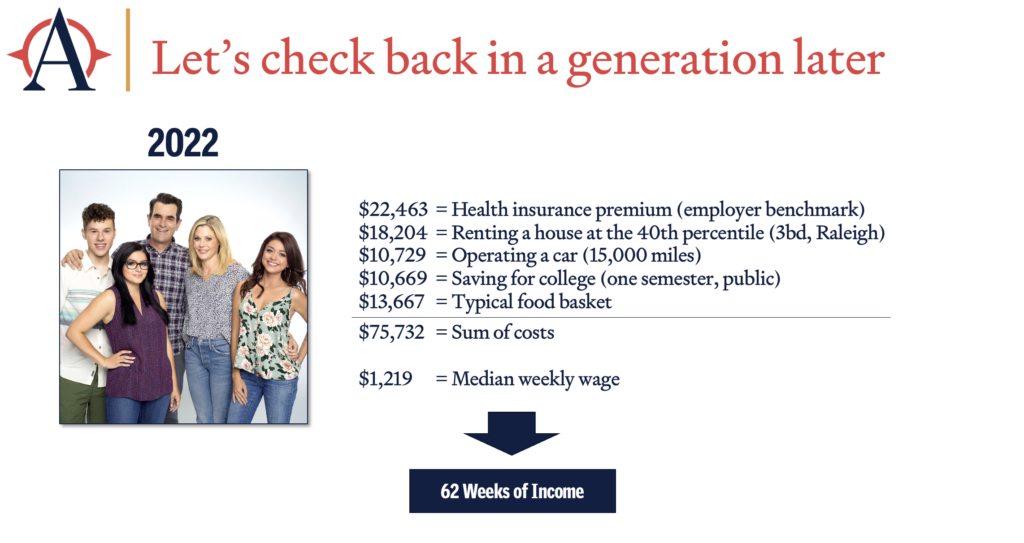
Let’s check back in a generation later, 2022. Now, these are not the same goods in the inflation sense. What you get for your health insurance in 2022, way more advanced treatments. What the house in the 40th percentile looks like, much nicer countertops, probably a lot bigger. The car has heated seats. College, different experience. All true, but if you think about the comparable 2022 version to the 1985 version, this is roughly what those things would cost, about $75,000.
Think of the incredible growth and the increases in prosperity we have had over the generation, weekly income was $1,219. That must have easily covered these expenses, shouldn’t it? It doesn’t. At the typical male earners median wage in 2022, you would need 62 weeks of income to cover those expenses.
So what is this telling us and what isn’t it telling us? Who has more income? It doesn’t tell us that. You’ll need a good inflation index to figure that out. Who has a higher standard of living? Even an inflation index is probably going to understate it, because of lots of new things we have that we didn’t used to have. But who can comfortably afford to provide middle-class security for a family? I would argue this makes a fairly compelling case. It’s the 1985 family.
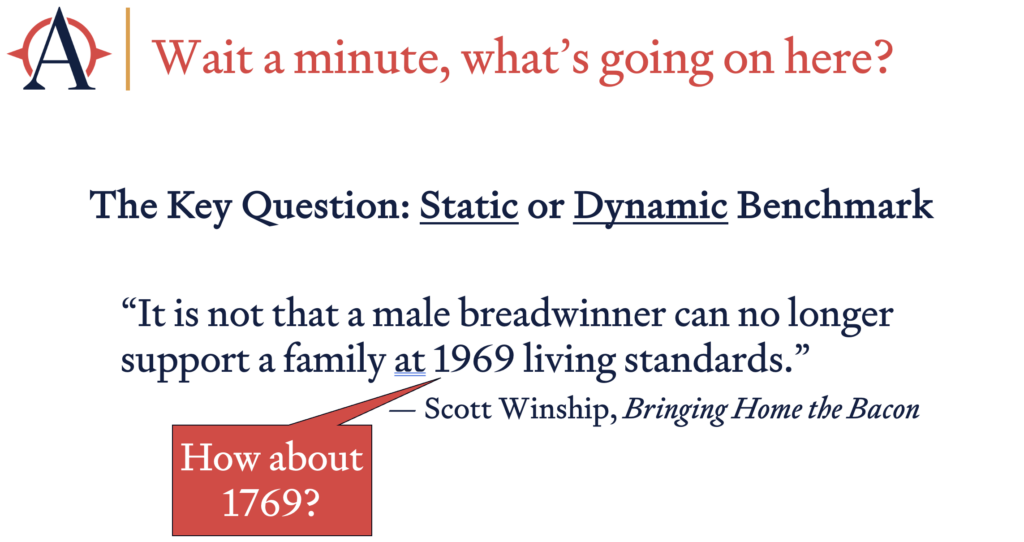
What’s going on here? I think the core of this debate is whether we prefer a static or a dynamic benchmark for wellbeing. And Scott actually had a wonderful paper in December, Bringing Home the Bacon, that made this very explicit. I don’t agree with his conclusion, but I very much like the way he framed it. Which is, he took a 1969 wage for someone ages 25 to 29 and said, “Well, how many people in the 2020s still have a 1969 wage?” And he concluded, “It is not that a male breadwinner can no longer support a family at a 1969 standard of living.” Totally agree.
The question is, is that the right question? And I think the best way to understand that it’s not, is to recognize that 1969 is a totally arbitrary standard. What if we crossed that out? Oh, no. On my slide, different dimension slide. Imagine the X was over the 1969, and that we’ve put in a 1769 instead. Would it be reasonable to say, “Well, whatever you needed to support a family in 1769, that’s the right question to ask about 2022?” Stretch it out a little longer, it starts to sound pretty ridiculous to me. But the reality is that 1969 is an awfully long time ago too, at this point. And at some point we’re going to have to recognize that modern America requires something different.
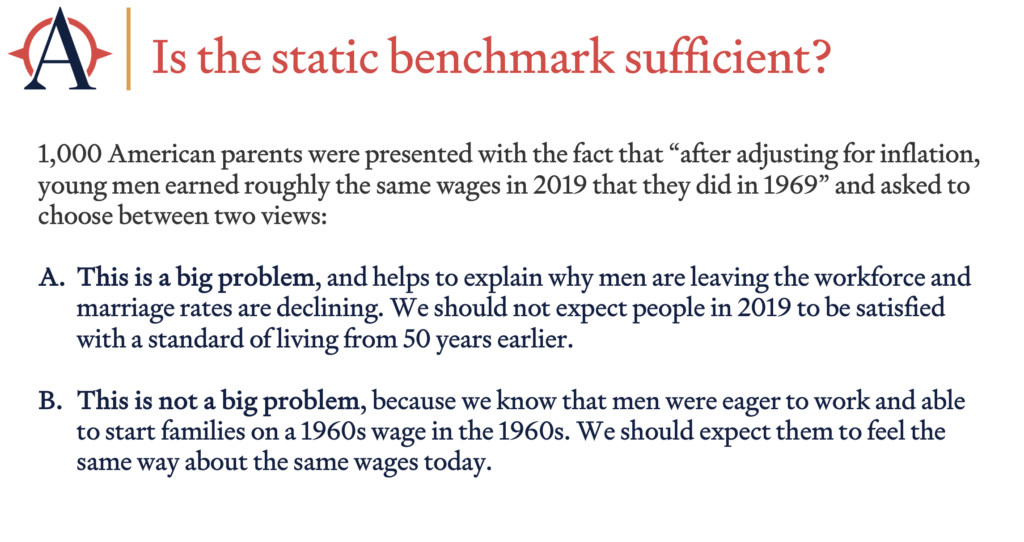
For what it’s worth, we also asked Americans this question. I was sufficiently inspired by the report to throw the question into a poll that we did. So we asked a 1,000 American parents many other things, but we also gave them this fact. After adjusting for inflation, young men earn roughly the same wages in 2019 that they did in 1969. And asked Americans, is this a big problem? Helps to explain why men are leaving the workforce. Marriage rates are declining. We should not expect people in 2019 to accept a 1969 standard of living. Or do you think it’s not a big problem? Because if men were eager to work and start families in the 1960s, they should do the same today.
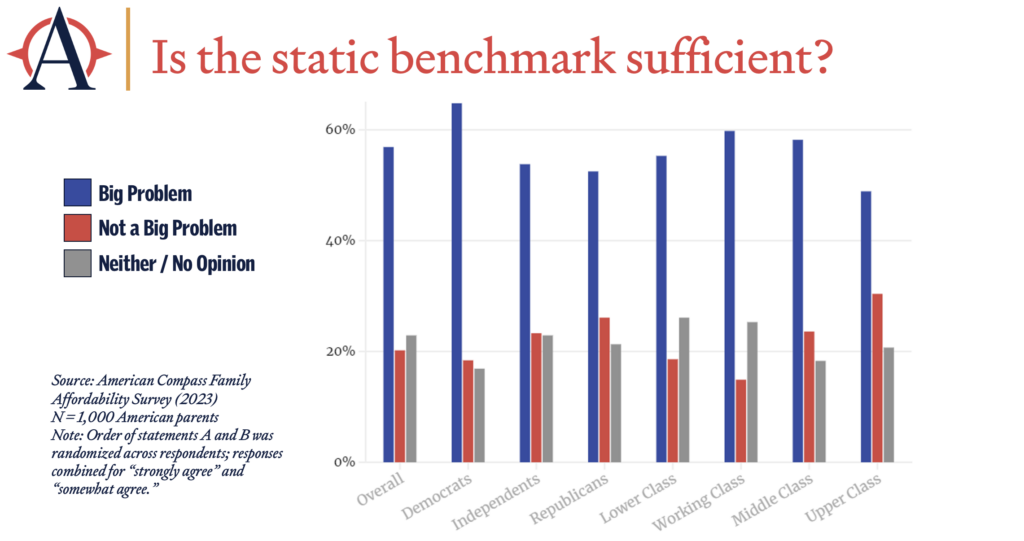
And this is the result. Big problem by about three to one. Across Democrats, Independents, Republicans. Across lower, working, middle and upper class. Interestingly, our upper class dual income college educated households are least likely to think it’s a problem. But everybody else does. And so again, you could say… And when our economists are defining their inflation measures, I would want them to say, ” It’s not really a question of how the American people feel.” But if you want to know what has actually happened in the economy and whether or not it has succeeded and delivered on its promise, I think we should ask. And we should care.
Final point I’d like to make. This debate has been going on for about three years now, and there’s a frustration that I want to focus in on as squarely as I can. And I’m hoping this forum will be a good one to move past it.
So within a month of releasing Cost-of-Thriving Index, I had to post a long response with many clarifications. And this was the biggest one. Misconception number one, COTI claims to “overturn decades of research by expert economists” or show “an ongoing deterioration in the standard of living.” Oren’s response. COTI does not reject existing statistics. It emphasizes they’re valid and useful. It underscores that material living standards have clearly risen. It offers COTI not as a replacement, but as a supplement that can depict a dimension other statistics don’t claim to measure. And as I quoted from the report, the report itself specifically says, “Alongside formal inflation, and a technical cost of living measure that aims to hold constant, absolute material consumption, an accurate depiction of economic trends would trap a more dynamic basket.” So that’s what we’re trying to do. And how the debate has felt to me is roughly like this. This is the best metaphor I could come up with, helpfully figured it out while staring out the window on the flight down. And on my slide, the sky is blue, which is actually very important for the metaphor.

It seems to me we have two sides to this debate. One that says, “The sky is blue.” And the other that says, “Yes, that’s true, but there are also a lot of clouds today. Those are gray.” Now notice the two sides are not speaking past one another. One is not saying, “The sky is blue.” And the other is saying, “The sky is gray.” One is saying, “The sky is blue.” And the other is saying, “Yes, but that is not the only thing we should want to know.”
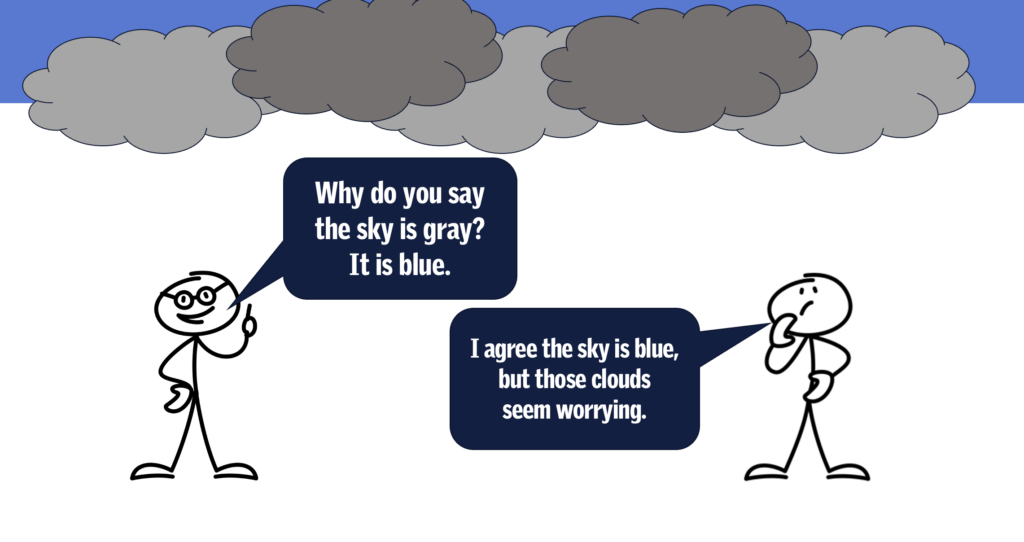
And it feels like the first person gets very frustrated and says, “Why do you say the sky is gray? The sky is blue.” And you could say, “No, no, I agree the sky is blue. But those clouds look worrying.”
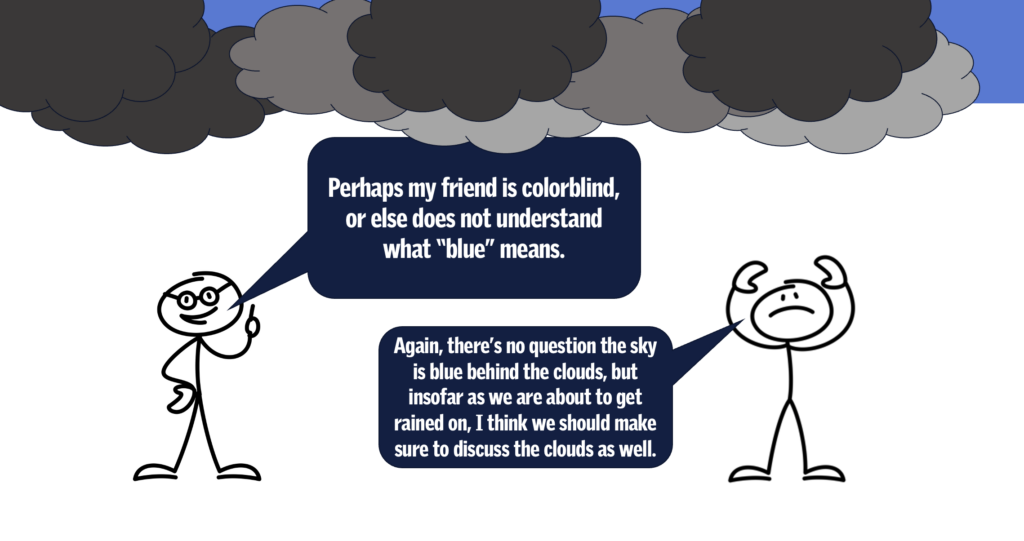
And then the first person says, “Maybe you are colorblind. Or perhaps you don’t understand what blue means.” And I become exasperated at this point and I say, “Again, I understand the sky is blue behind the clouds, but I’m afraid we are about to get rained on.”
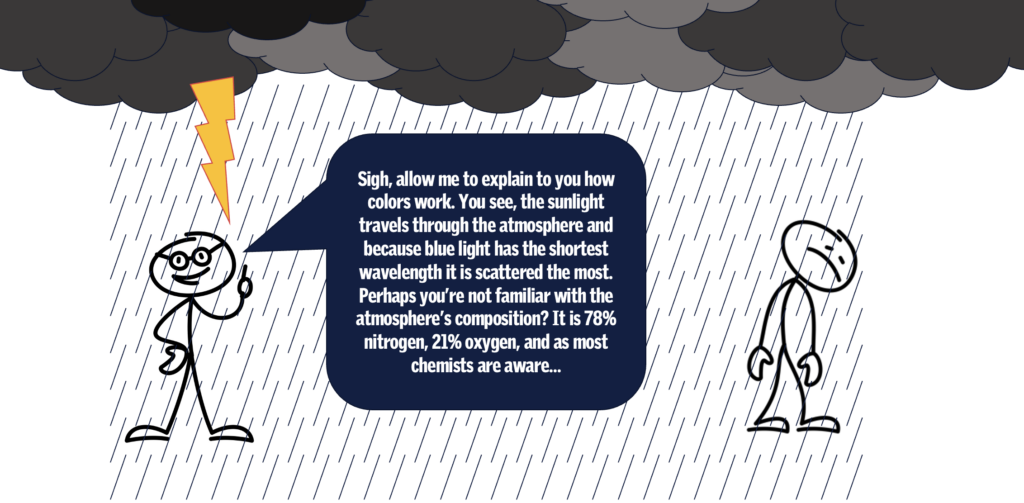
And then we get into a very technical definition about how color works and the way light is defracted through the atmosphere, and the composition of the atmosphere. And then we get rained on.
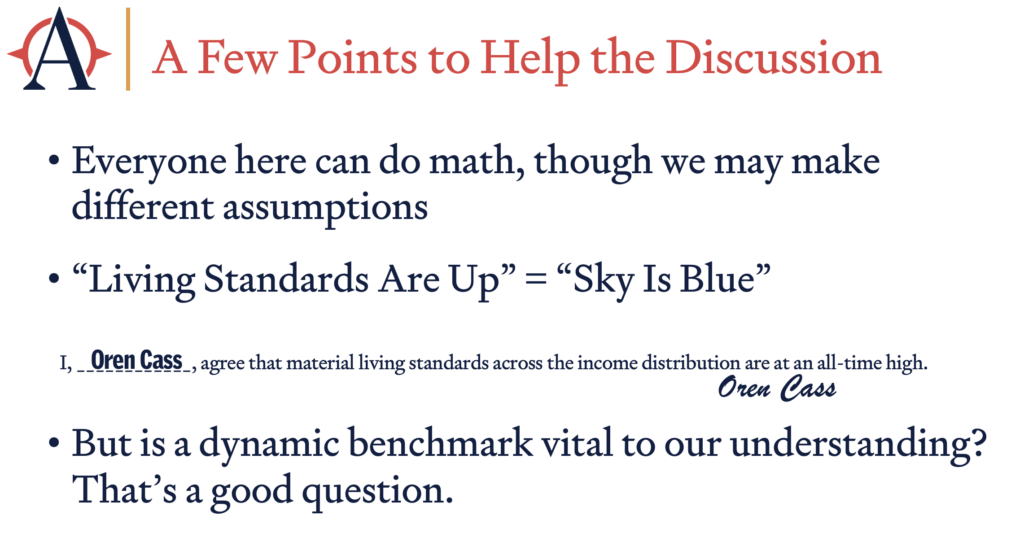
And so I just wanted to conclude with a few points that I hope will help the discussion we have today. The first is that everyone here can do math. And the debate is about assumptions. There has been criticism of Cost-of-Thriving Index, that it is bad math. I don’t know that anyone has ever done this. We released an entire workbook with the update this year. All of the underlying Excel, all of the raw data, all of the alternative assumptions you could make. And a tool to make any assumptions you want to see how it changed it.
As far as I know, there is nothing wrong with any of the data or the calculations. And if there is, I will gladly admit it and we will update it. The question is this conceptual one, about what we should care about. The second point is that nobody here disagrees that living standards are up. It is the equivalent of saying the sky is blue. If there’s any doubt about it, I have included a statement here. I, Oren Cass agree that material living standards are up. And I have signed it. But is a dynamic benchmark vital to our understanding? That is a critical question. And it’s one I hope we will discuss further. Thank you very much.

Recommended Reading

The 2023 Cost-of-Thriving Index
Tracking the catastrophic erosion of middle-class life in America

Family Affordability Survey
American families, across parties and classes, broadly share a definition of the middle class and concern with how the economy has made middle-class life harder.

Critics Corner with Angela Rachidi
On this episode of Critics Corner, Oren Cass is joined by AEI’s Angela Rachidi to discuss family affordability.