


Patterns of change in the U.S. labor market, 2000–2019
Recommended Reading
Executive Summary
Conventional wisdom holds that globalization has shifted the U.S. labor market’s trajectory, reducing demand for less educated workers while increasing it for college degree holders, such that overall prosperity has risen and improved education holds the key to sharing that prosperity broadly. Employers lament “skills gaps” and their lobbyists argue that more foreign talent must be imported for the economy to remain competitive.
Labor market data discredit this view. While the share of American jobs requiring a college degree has increased in recent decades, the share of workers holding college degrees has risen much faster. Yes, wages rose in those degree-requiring jobs, but for tens of millions of Americans holding such degrees, no such jobs exist. For most of the jobs that do exist, which still require only a high school degree, wages have stagnated.
This analysis of U.S. Bureau of Labor Statistics data finds that:
- From 2000 to 2019, the U.S. labor market added 22 million workers over the age of 25 with at least a bachelor’s degree (BA+) but only 10 million jobs requiring at least a bachelor’s degree.
- While BA+s accounted for 97% of net worker growth, 41% of net job growth required a high school degree or less.
- In 2019, BA+ jobs still accounted for just 27% of the workforce, but they captured 75% of the total 2000–19 increase in wages paid. While the wage distribution for BA+ jobs shifted significantly upward over the period, the distribution for other jobs did not.
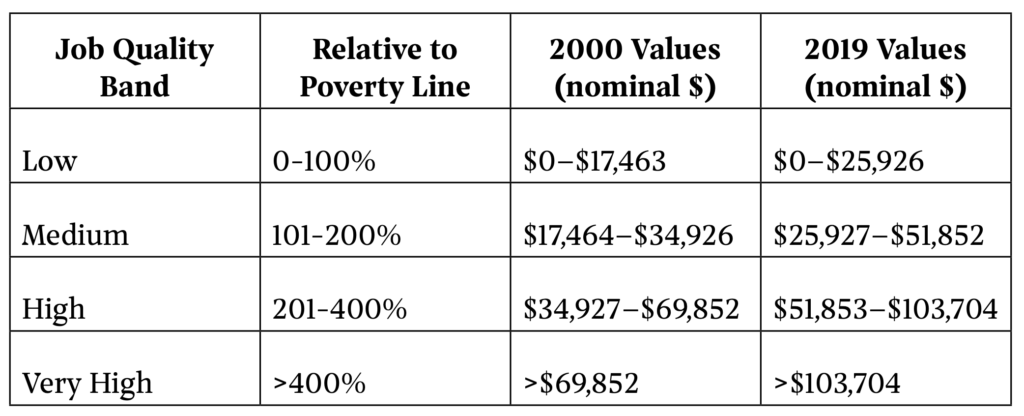
- For BA+ jobs, the share paying 200–400% of the poverty line for a family of four fell from 84% to 73% while the share paying >400% rose from 9% to 19%.
- Non-BA jobs saw a net shift of two points from jobs paying below the poverty line to ones paying between 100–400% of the poverty line.
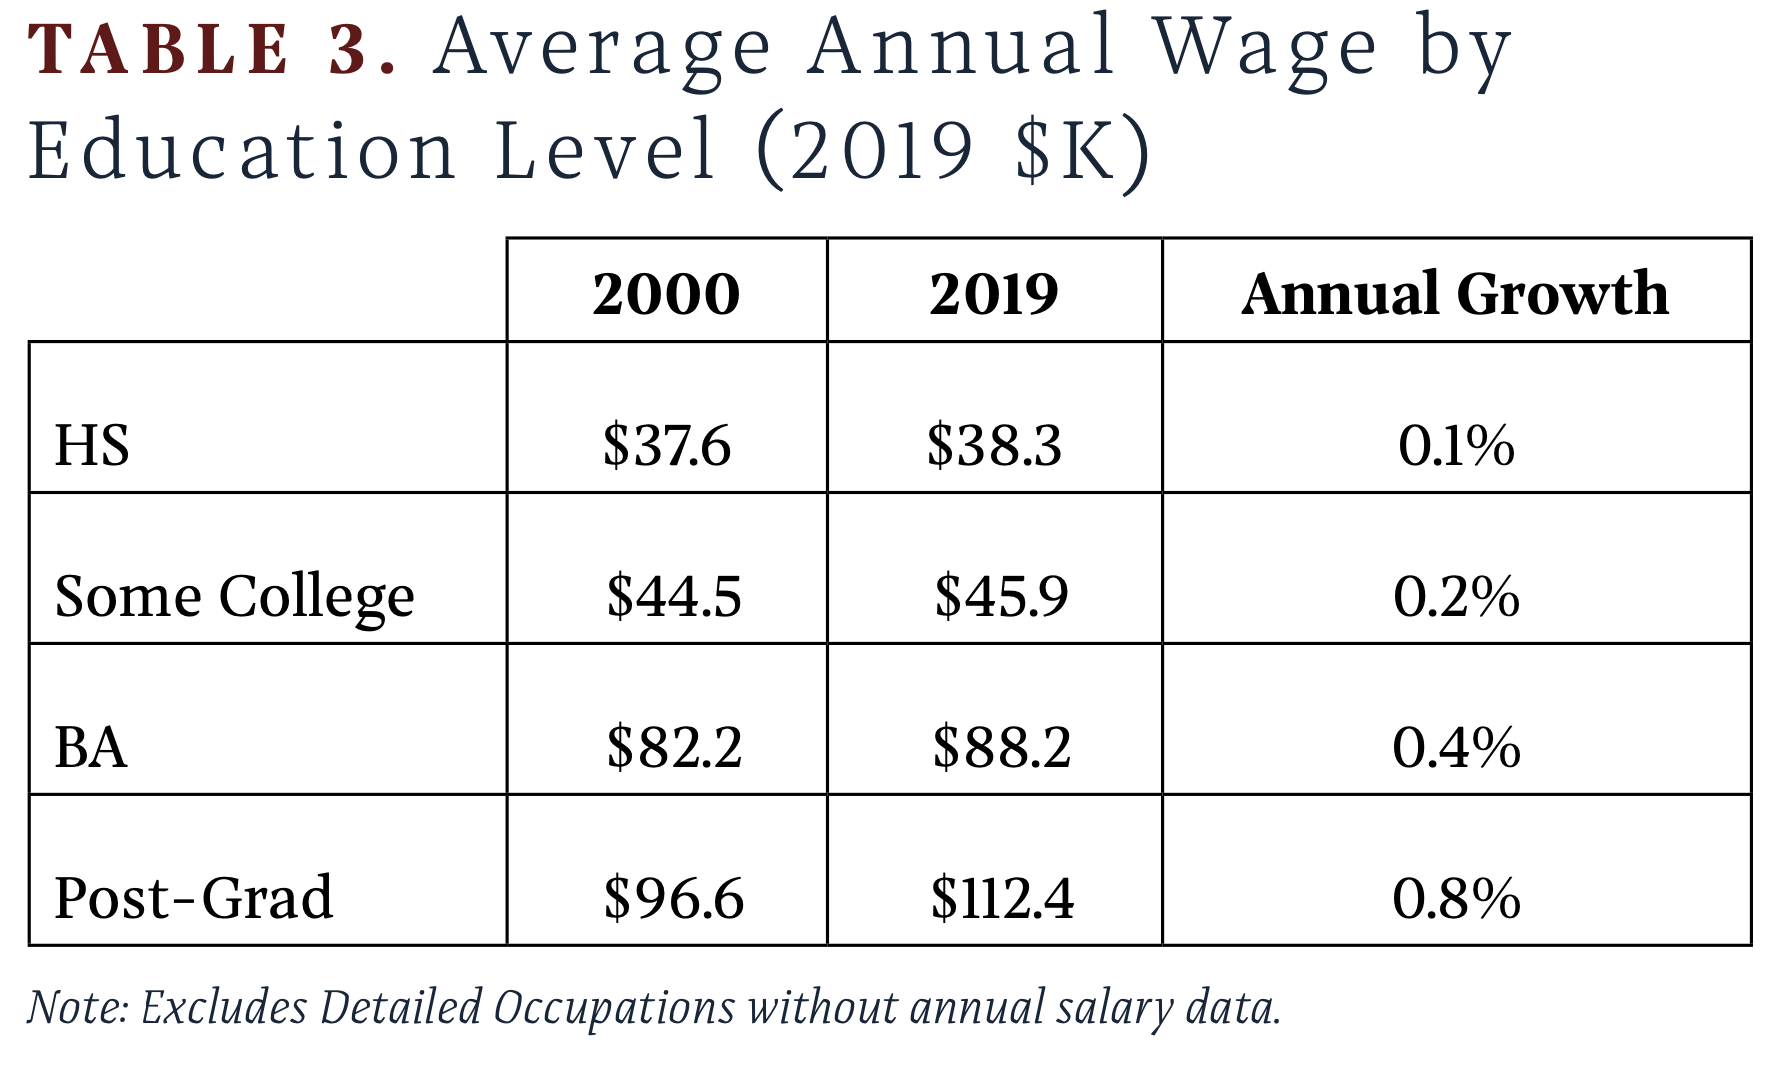
- Jobs requiring some college or an associate’s degree did not perform like BA+ jobs; they performed little better than jobs requiring a high school degree or less. Jobs requiring some college saw annual wage growth of less than two-tenths of one percent, slightly above wage growth for jobs requiring a high school degree or less; wages for BA+ jobs grew three times faster.
- The labor market saw a net shift of 4 million workers from high-school-or-less to some-college, but it added only 1 million jobs requiring some college.
Pushing more young Americans through the broken college pipeline will do nothing to address these dynamics. Economic reforms must alter the pattern of growth in labor market demand.
Introduction
Economic analysis and political commentary often emphasize job quantity. Policymakers monitor the unemployment rate and try to pursue the fiscal and monetary policy that will achieve “full employment.” They appear to have been fairly successful. From 2000 to 2019, the U.S. labor market added 17 million jobs. Despite the Great Recession, the unemployment rate in most years held below 5.5%.
But job quality is as important as quantity, especially when evaluating the effects of a broad economic transition like globalization. As Harvard University economics professor Greg Mankiw has observed, “Full employment is possible with any pattern of trade. The main issue is not the number of jobs, but which jobs.” Unfortunately, Mankiw goes on to say: “Americans should work in those industries in which we have an advantage compared with other nations, and we should import from abroad those goods that can be produced more cheaply there.” This perspective, so common among economists, misunderstands the nature of comparative advantage and global trade balances. The formula is an excellent one for producing cheap stuff, but nowhere does it suggest that those industries in which America can produce things most cheaply will be those offering good jobs that allow American workers to support their families and communities. Moreover, a pattern of trade that permits large financial imbalances and thus trade deficits may also see American workers depart industries that produce anything other countries might want, landing instead in a low-wage, low-productivity domestic service sector.
Measuring the quality of jobs is harder than just counting them, but without such measurement one can conclude little about a labor market’s trajectory. Basic trends in median wages and income inequality give some indication, but they are akin to taking the labor market’s temperature. They can help detect a problem, but not the underlying condition. MIT economics professor David Autor has done important work studying polarization within the labor market, and metrics like the Coalition for a Prosperous America’s Job Quality Index (JQI) show the rising share of American workers who are falling behind. But they tend to still leave a question of who is being affected how, and why.
This paper adds to the job quality literature by studying the labor market’s composition across the educational requirements of jobs and the educational attainment of workers. It finds that the “winners” in the modern economy are not so much those workers who obtain a college degree, but rather those who secure a job requiring that degree. America is overproducing college graduates at an alarming rate or, put another way, globalization’s promise of requiring and rewarding much higher levels of education has not materialized. Meanwhile, most jobs still require only a high school degree, and their wages have stagnated.
Median wage is of course only one measure of job quality; further analysis would ideally offer a richer view of how job characteristics have evolved over time. But broad indicators are discouraging: A recent survey by American Compass found that only 30% of America’s non-supervisory workers have secure jobs, defined as those paying more than $40,000 per year for more than 30 hours per week, with benefits and predictable earnings and hours. America must find a model of economic growth that begins quickly to increase that share.
I. Data Sources and Methodology
This paper uses 2000 and 2019 Occupational Employment and Wage Statistics data published by the U.S. Bureau of Labor Statistics (BLS), which estimates wages and employment levels for 700 to 800 different occupations each year (excluding the self-employed), available at https://www.bls.gov/oes/tables.htm. Occupations are classified by educational requirements using data from the BLS Employment Projections table 5.4, available at https://www.bls.gov/emp/tables.htm.
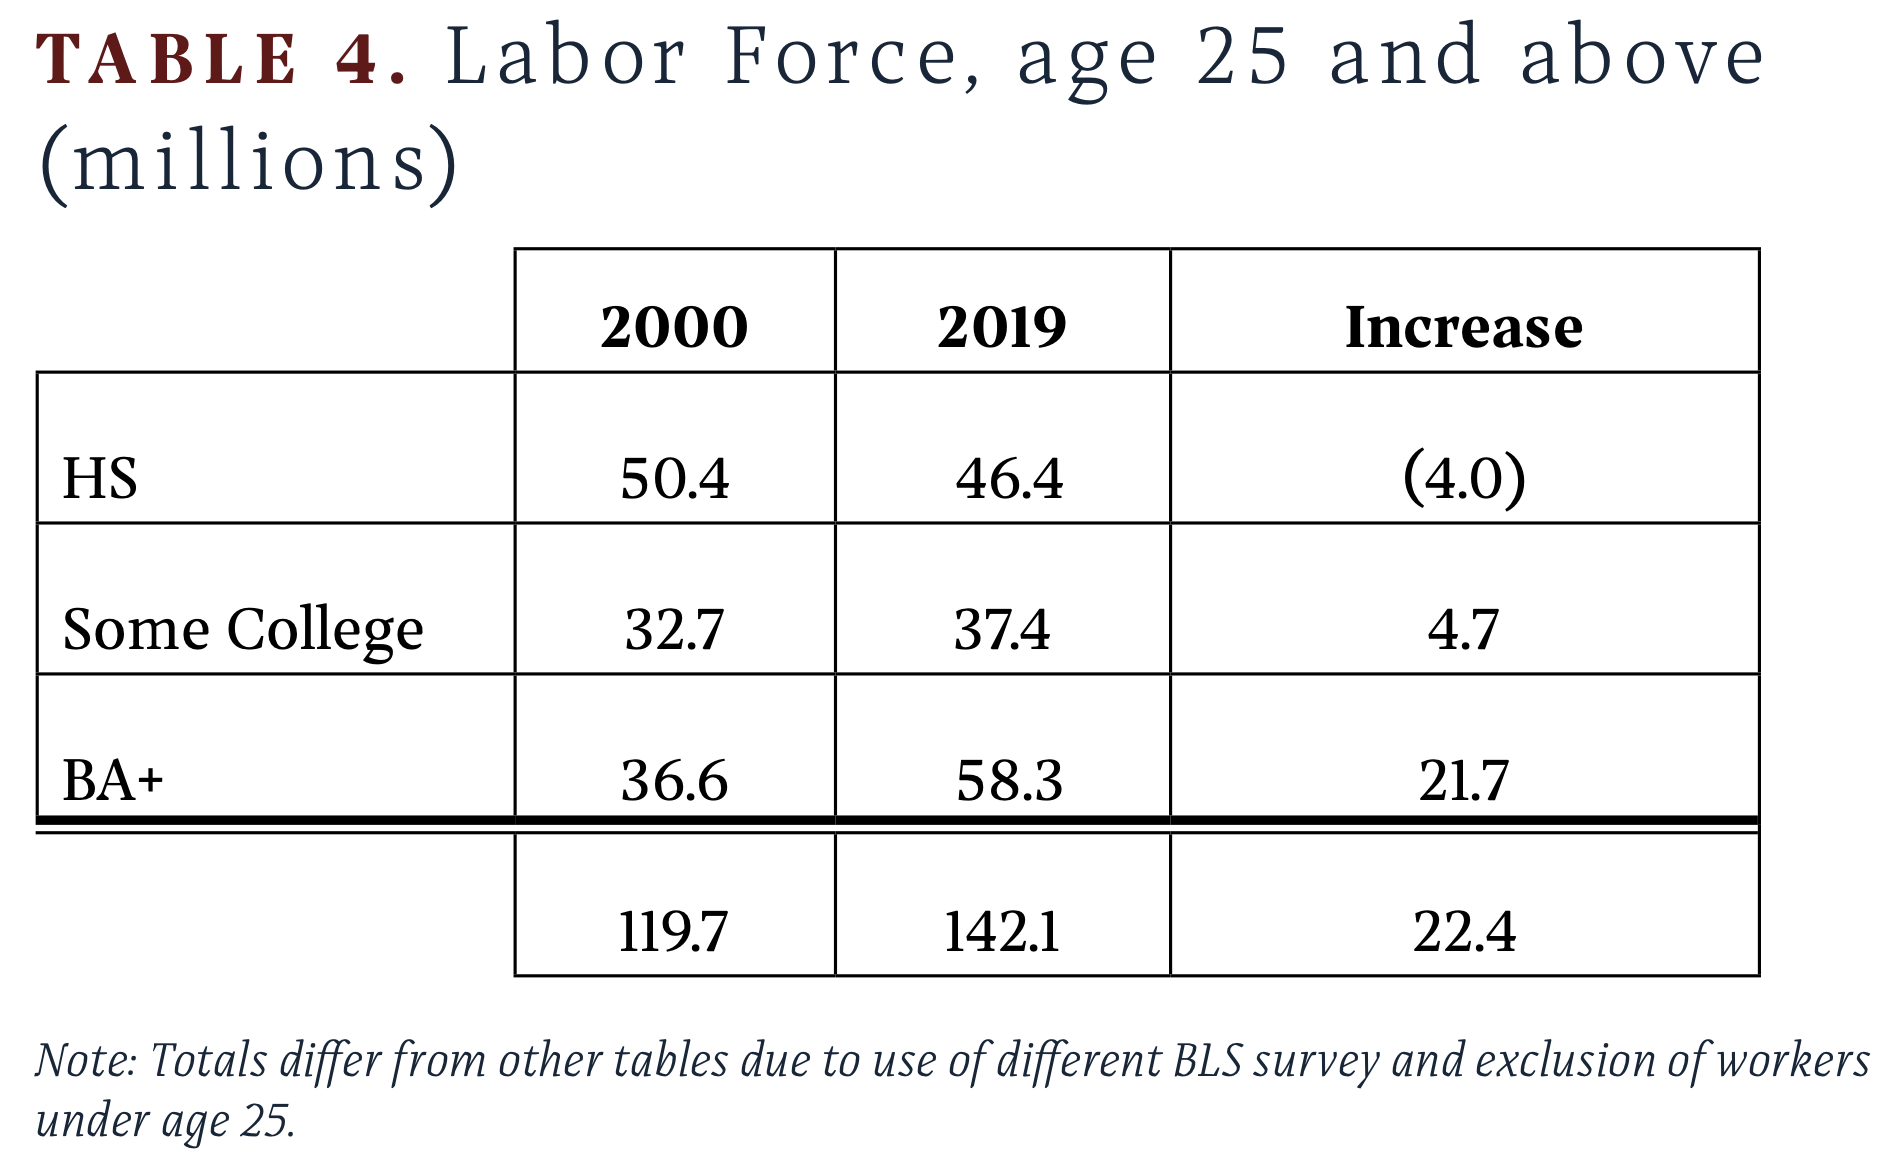
For labor force composition by education level, the paper uses data from the BLS Current Population Survey for workers over age 25, so totals differ slightly from those reported for job categories.
The years 2000 and 2019 are chosen as start and end years because both represent the peak of business cycles, with unemployment rates reaching lows of 3.8% and 3.5%, respectively.
Key Terms
- Major Occupation: The broadest set of occupational categories provided in the BLS data, for example “Architecture and Engineering Occupations.”
- Detailed Occupation: The most granular set of occupational categories provided in the BLS data. For example, BLS identifies “Architecture and Engineering Occupations” as a major occupation comprising 35 detailed occupations such as “Mechanical Engineer,” “Civil Engineer,” and “Petroleum Engineer.”
- Wage Pool: Total compensation paid to a particular group of workers in a particular year. For instance, the wage pool for all Civil Engineers is equal to the Detailed Occupation’s mean annual wage multiplied by its total number of employees.
- Job Quality: Each Detailed Occupation is assigned a Job Quality based on its median wage compared to the U.S. Census Bureau’s poverty threshold for a family of four in that year.
- Education Level: Each Detailed Occupation is assigned a Job Quality based on the “typical education needed for entry,” as defined in the 2019 BLS Employment Projections Program. “HS” refers to a high school degree or less. “Some College” refers to some college attendance but less than a bachelor’s degree, including attainment of an associate’s degree or certificate. “BA” refers to a bachelor’s degree, “Post-Grad” refers to a degree above BA, and “BA+” refers to both categories combined.
Data Adjustments
- Occupation Mapping: From 2000 to 2019, BLS revised its Detailed Occupation classifications, increasing the total from 711 to 789. Of the 711 classifications in 2000, 112 were no longer active in 2019, having either been reassigned to a new code with the same title or else merged into a different code and title. In this analysis, each of those extinct Detailed Occupations is mapped to its closest 2019 Detailed Occupation for purposes of assigning Education Level; all mappings are listed in the Appendix.
- Total Employment Scaling: In the 2019 data, the sum of employment levels in all Detailed Occupations (146.9M) closely approximates the total reported for Major Occupations (146.9M). In the 2000 data, however, the Detailed Occupations sum is approximately 7% below the Major Occupations sum, reflecting a significant number of jobs not classified in any Detailed Occupation category. Detailed Occupation employment totals in 2000 are therefore scaled up by a fixed ratio within each Major Occupation so that their sum matches the total for that Major Occupation. This scaling increases 2000 employment levels in BA+ jobs slightly more than in HS jobs, which is consistent with the new Detailed Occupations added by BLS after 2000 also skewing slightly toward BA+ jobs.
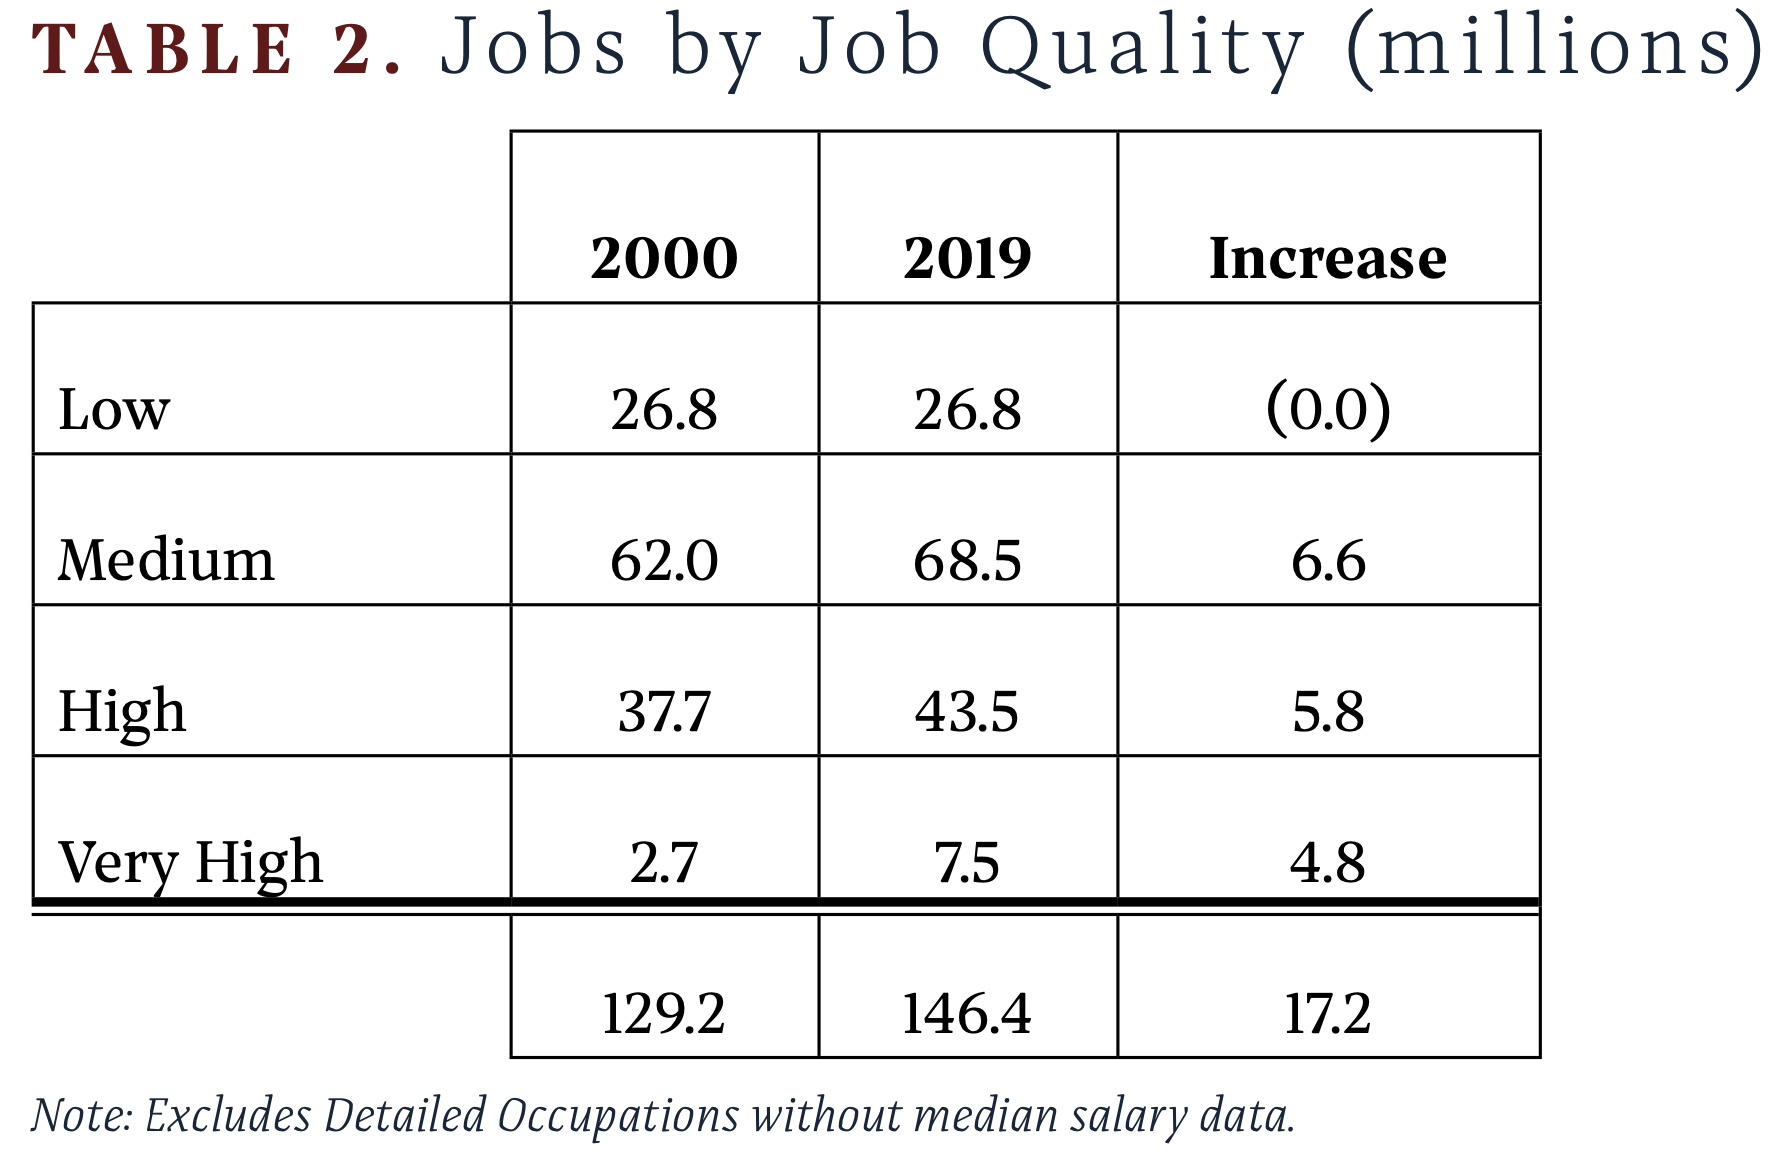
- Excluded Detailed Occupations: Actors, Musicians, Dancers, Airline Pilots, and Flight Attendants (less than 0.5% of total employment) lack annual wage data and are excluded from all wage-related analyses. Some categories of doctors (less than 0.1% of total employment) lack median wage data and are excluded from wage-related analyses that require category-specific median data.
- Inflation Adjustments: For wage comparisons between 2000 and 2019, 2000 wages are inflated to 2019 dollars using a factor of 1.49 based on the Consumer Price Index for All Urban Consumers for January 2000 (169.3) and January 2019 (252.5).
Final Dataset
The final dataset includes 22 Major Occupations for both 2000 and 2019, with 711 Detailed Occupations in 2000 and 789 in 2019.
These occupations employed 130 million people in 2000 and 147 million people in 2019 (for comparison, the BLS Current Employment Statistics reports total employment of 132 million in 2000 and 151 million in 2019). These occupations generated total wages and salaries of $6.3 trillion (2019 dollars) in 2000 and $7.8 trillion in 2019 (for comparison, the BLS Quarterly Census of Wages and Employment reports total wages and salaries of $6.8 trillion in 2000 and $8.8 trillion in 2019.
This dataset provides in many respects a crude picture of the labor market’s evolution. But the picture is a stark one and, as a first approximation, it improves significantly upon what people simply assume to be true.
II. Data Overview
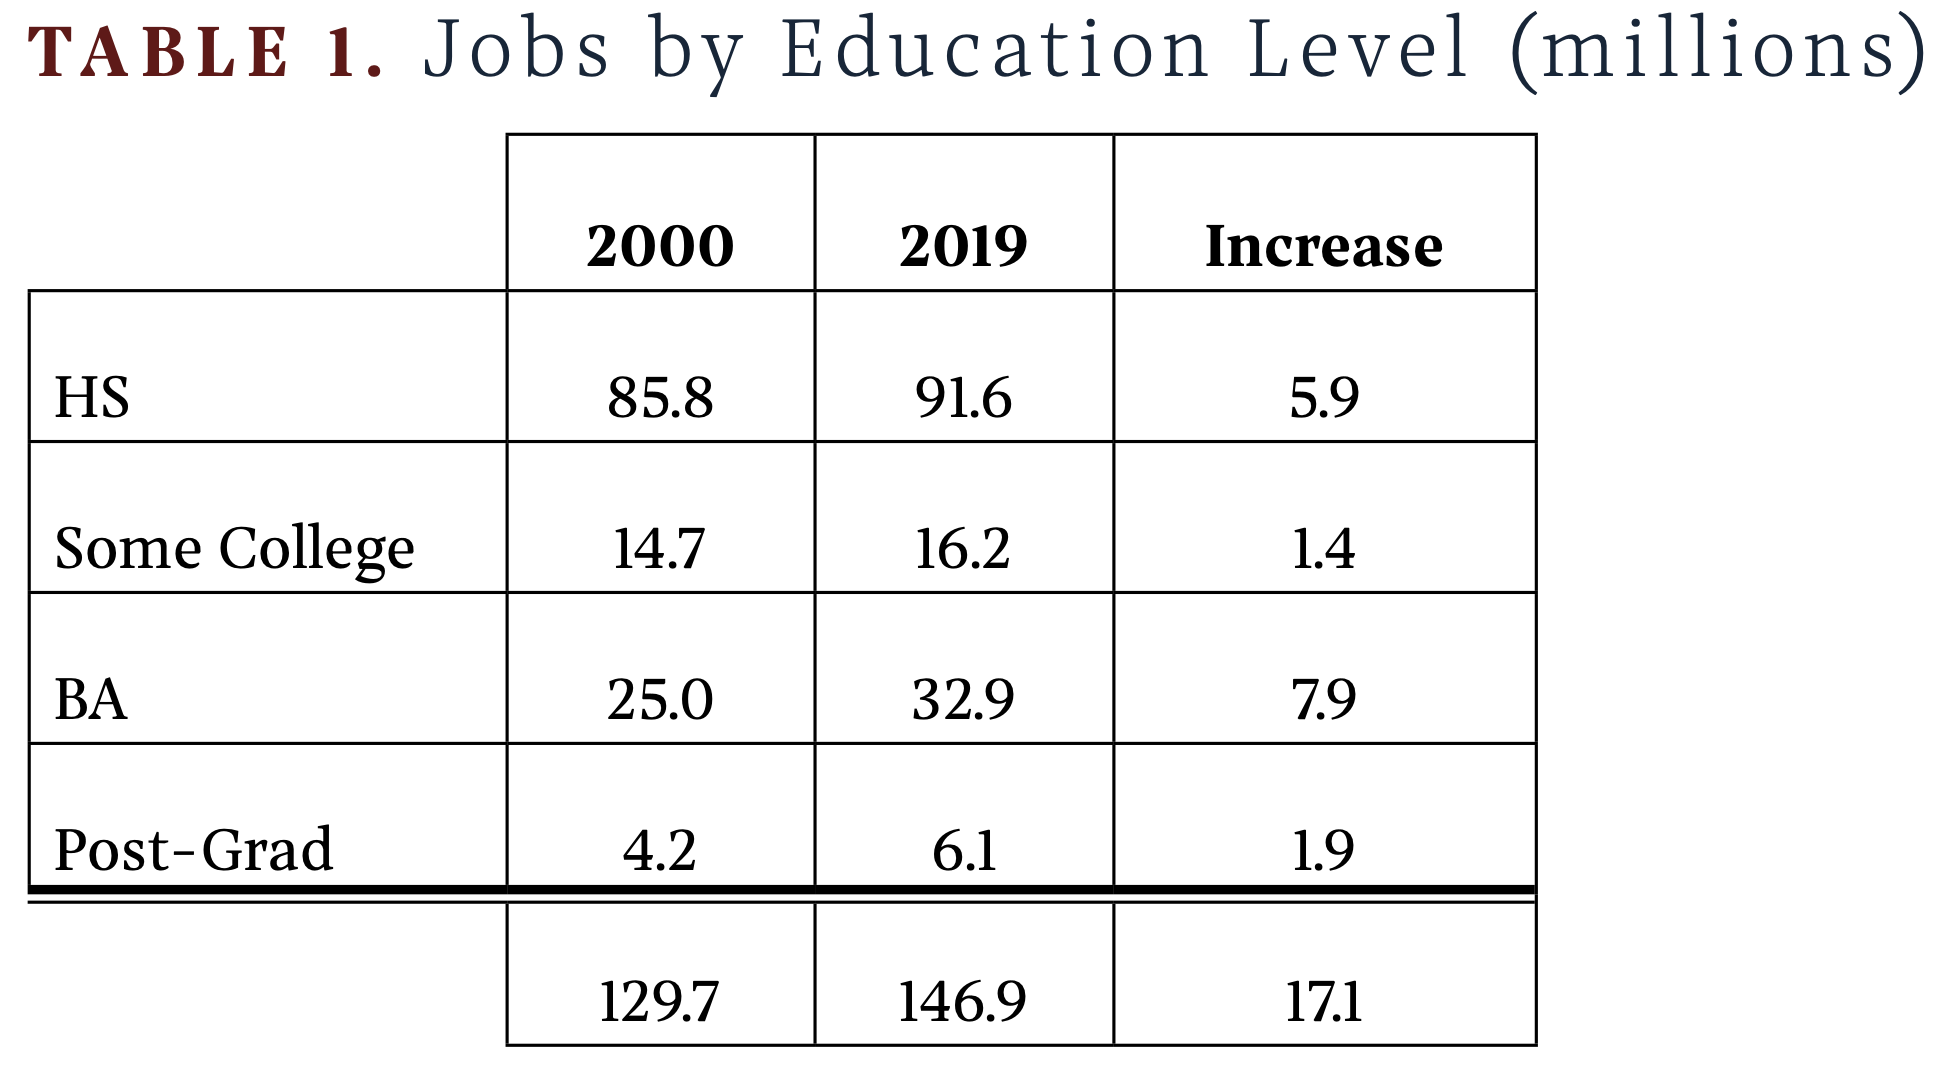
The U.S. labor market added 17 million jobs from 2000 to 2019, of which 6 million required a high school degree or less, 1 million required some college, and 10 million required a bachelor’s degree or more. Relative to the pre-existing distribution of jobs, this represented a shift toward jobs requiring higher levels of education; however, HS jobs continue to represent more than 60% of the total.
By wage level, net additions to the labor market were disproportionately in higher paying jobs. In absolute terms, the largest gain occurred, and the largest share of jobs remains, in the Medium category with wages between 100% and 200% of the poverty line.
Average (mean) wages increased in occupations across all education levels; however, growth was significantly higher for jobs requiring higher levels of education.
The composition of workers changed in ways different from the composition of jobs. Nearly the entire net increase in labor force participants occurred among BA+ workers, while the number of HS workers declined substantially.
III. Key Findings
Substantial economic gains have accrued in recent decades to Americans working in jobs that require college degrees. This is not the same, however, as saying that gains have accrued to Americans overall, or even to Americans who hold college degrees. Rather, the labor market’s trajectory has been one that produces benefits primarily for a subset of college graduates who had the highest earnings to begin with. By contrast, America’s economic growth has failed to ensure that gains are broadly shared by the vast majority of Americans with no college degree, or even to expand opportunity for those who do pursue one.
From 2000 to 2019, BA+ jobs increased from 22% to 27% of the labor market. They accounted, however, for 75% of the total increase in wages paid economy-wide.
Indeed, while BA+ jobs saw a significant upward shift in their wage levels, with many jobs growing in, and occupations moving into, the Very High category, non-BA jobs saw no such shift and workers in those jobs were nearly as likely to be earning at a given level as two decades earlier. From 2000 to 2019, the share of non-BA jobs paying even 200% of the poverty threshold increased only from 13% to 14%, while 92–93% of BA+ jobs exceeded it.
If earning a BA at least provided reliable access to the higher end of the labor market, policymakers could argue that the solution to this bifurcated market lies in greater investment in education—certainly, that’s the argument they do make. Alongside, the multinational corporations who have most benefited from globalization lament a “skills gap” and insist they are creating the jobs of the future if only Americans were prepared to fill them.
This is, empirically, false.
In fact, the net increase in BA+ workers has outpaced the net increase in BA+ jobs by more than two-to-one. BA+s accounted for 97% of net worker growth, but 41% of net job growth required a high school degree or less. Put another way, in 2000 there were enough BA+ jobs for 79% of BA+ workers, but by 2019 there were enough for just 67%.
An Economics 101 analysis of this dynamic would predict that BA+ jobs should have seen relatively weaker wage growth, while HS and Some College jobs saw greater gains. On one hand, the excess supply of BA+ workers should have driven down BA+ wages. On the other hand, the higher human capital of workers in historically non-BA jobs should have boosted their productivity and thus wages. Of course, nothing of the sort has happened.
Instead, the limited set of jobs whose value has risen significantly with the economy’s evolution delivered enormous gains for the one-quarter of workers able to obtain them, while many college degrees pursued and acquired at enormous cost proved to have little or no labor market value.
Conclusion
Policymakers and economists tend to speak about a bifurcation in the economic outcomes for Americans who have and have not received bachelor’s degrees, leading to overwhelming emphasis on helping more Americans earn those degrees. This is not quite right. The bifurcation is better understood as existing between those who obtain the limited set of high-quality jobs requiring higher education and those who do not. And many (especially, in all likelihood, those at the margin) who are earning BAs appear not to be obtaining labor market value from them at all. Thus, the American labor market has two problems: First, that it is not producing the promised increase in high-quality jobs to absorb the nation’s investment in higher education, and second, it is not producing meaningful gains for the majority of Americans who do not and will not earn bachelor’s degrees regardless.
“Supply side” labor market solutions focused on creating more college graduates will solve neither of these problems. Economic reforms that yield a different pattern of growth in labor-market demand will be necessary to realize the promise of broadly shared prosperity.


Recommended Reading

Retooling American Education
How to Move Beyond College-for-All

The Workforce Training Grant
Public policy should recognize that employers, not universities, often provide the most socially valuable form of training and should redirect public resources accordingly.
A Guide to College-for-All
The college-for-all model fails most Americans in favor of a “Fortunate Fifth” who proceed smoothly from high school to college to career.